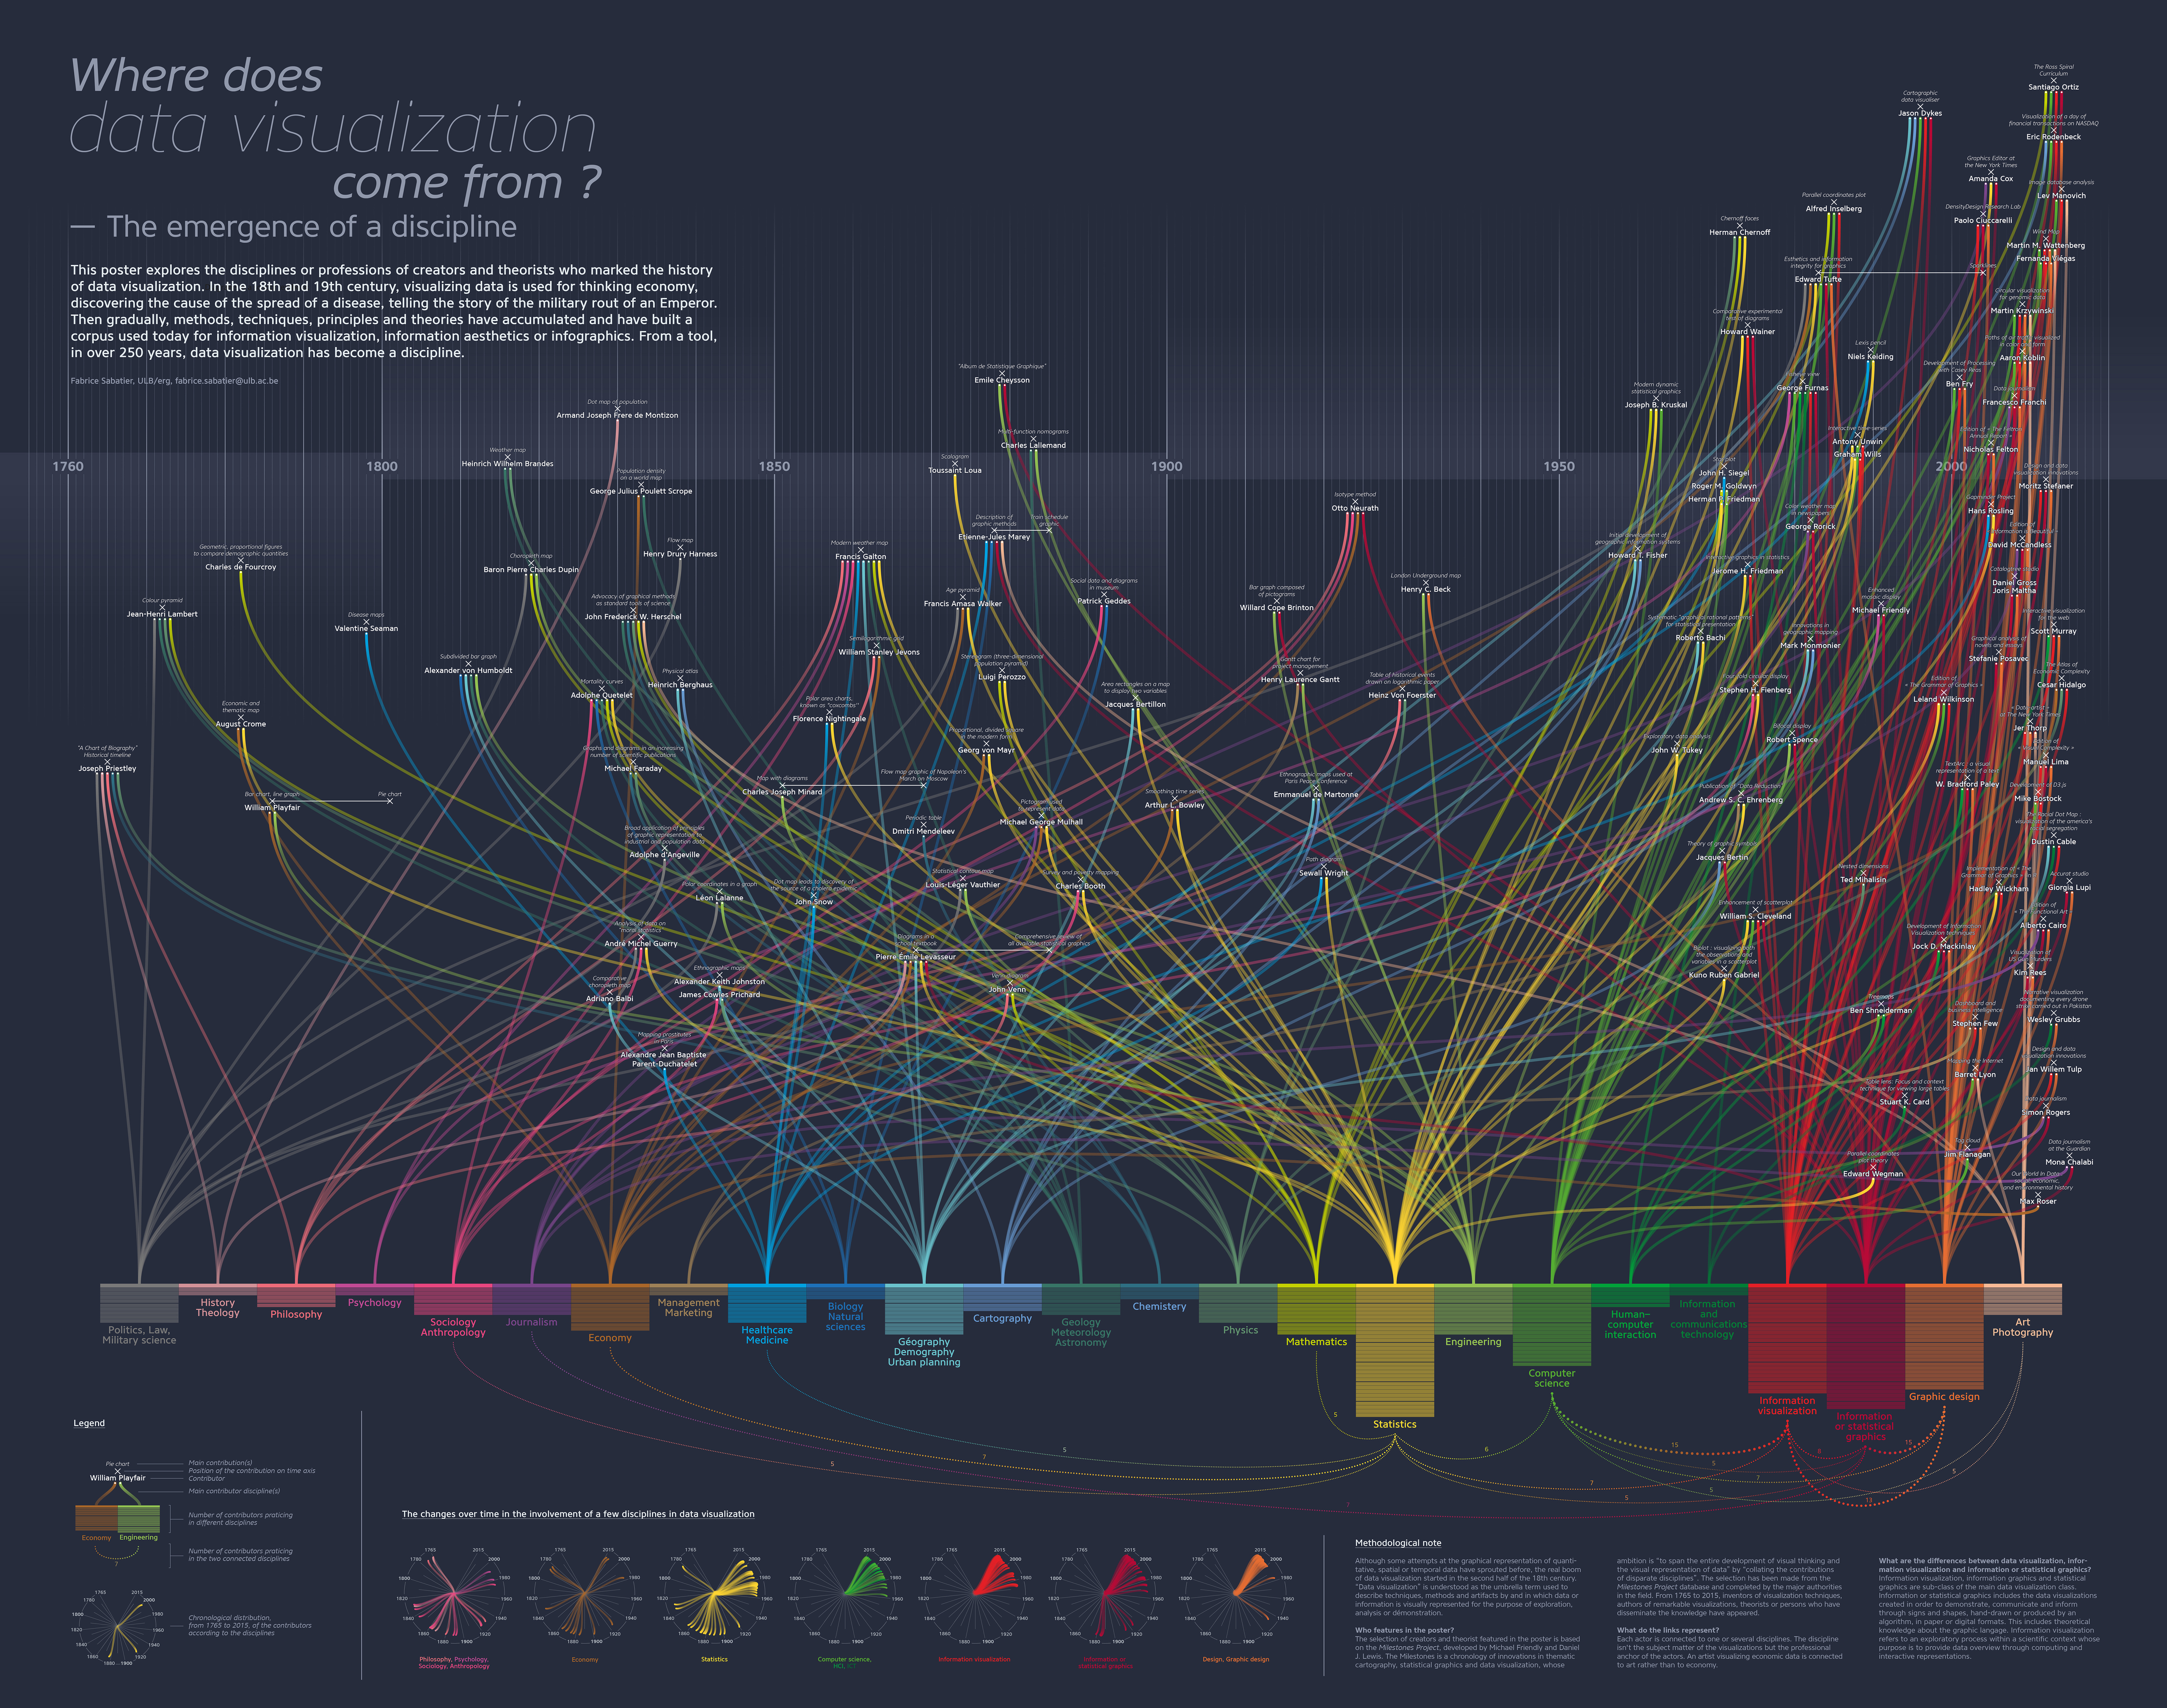
Where does data visualization come from? by Fabrice Sabatier
This poster explores the disciplines or professions of creators and theorists who marked the history of data visualization. In the 18th and 19th century, visualizing data is used for thinking economy, discovering the cause of the spread of a disease, telling the story of the military rout of an Emperor. Then, methods, techniques and theories have accumulated and have built a corpus used today for infoviz or infographics. From a tool, in over 250 years, data visualization has become a discipline.
-
CreditsFabrice Sabatier
-
Award
-
Categories
-
See more


