Physical Diagram - Interventions In Public Space by Roni Levit
The ‘Bursa’ industrial area in Ramat-Gan has been undergoing a process of change as efforts are made to transform it into Tel aviv's business center. The change are far from being complete as the streets are still pretty dodgy at night, uninviting to pedestrians, and very polluted.
In order to bring forward the dilemmas raised by this urban process, I created public interventions, spatial diagrams in various public spaces.
The city elements (stairs, tiles) were used to convey quantitative data and creates a story that allows the inhabitants to gain insights regarding the space in which they live in.
Experience data by climbing on it, walking through it and being immersed in it .
Diagrams translation:
01: Not enough green - Trees per person worldwide:
Greece 295, Ethiopia 143, Turkey 115, GB 47, Israel 2, Jordan 1
02: 80% of resting spots in the area are not shaded during the hot summer
03: Insufficient venting - Carbon footprint for different food industries:
The largest by far is the red line- The meat industry
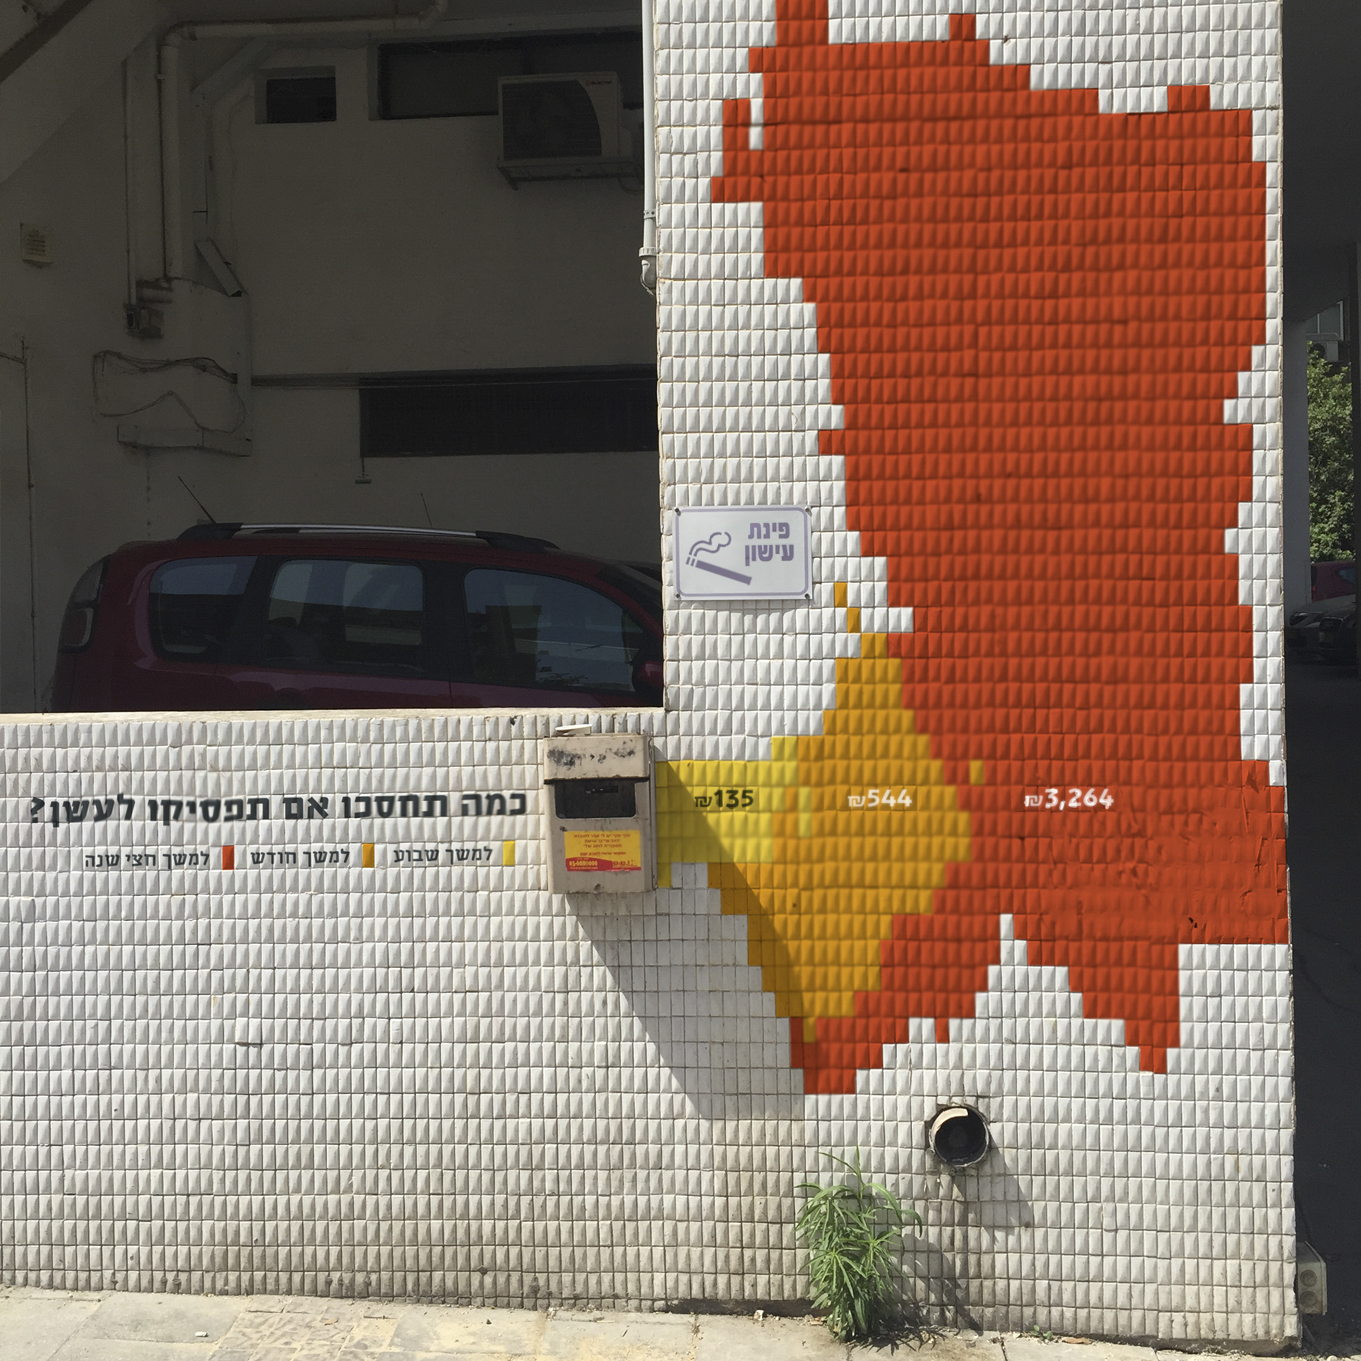
04: No official smoking spots - How much can one save when quitting to smoke for a week, a month, 6 months
05: Insufficient lighting - Electricity use show only 22% for lighting
-
Creditsthis project was commissioned by the "Ramat-Gan municipality, and was a part of the project "seed city" a call for creative actions in the public sphere initiated by the "Onya collective- a green house for urban environments" onyacity.com/seedcity2
-
Award
-
Categories
-
See more


