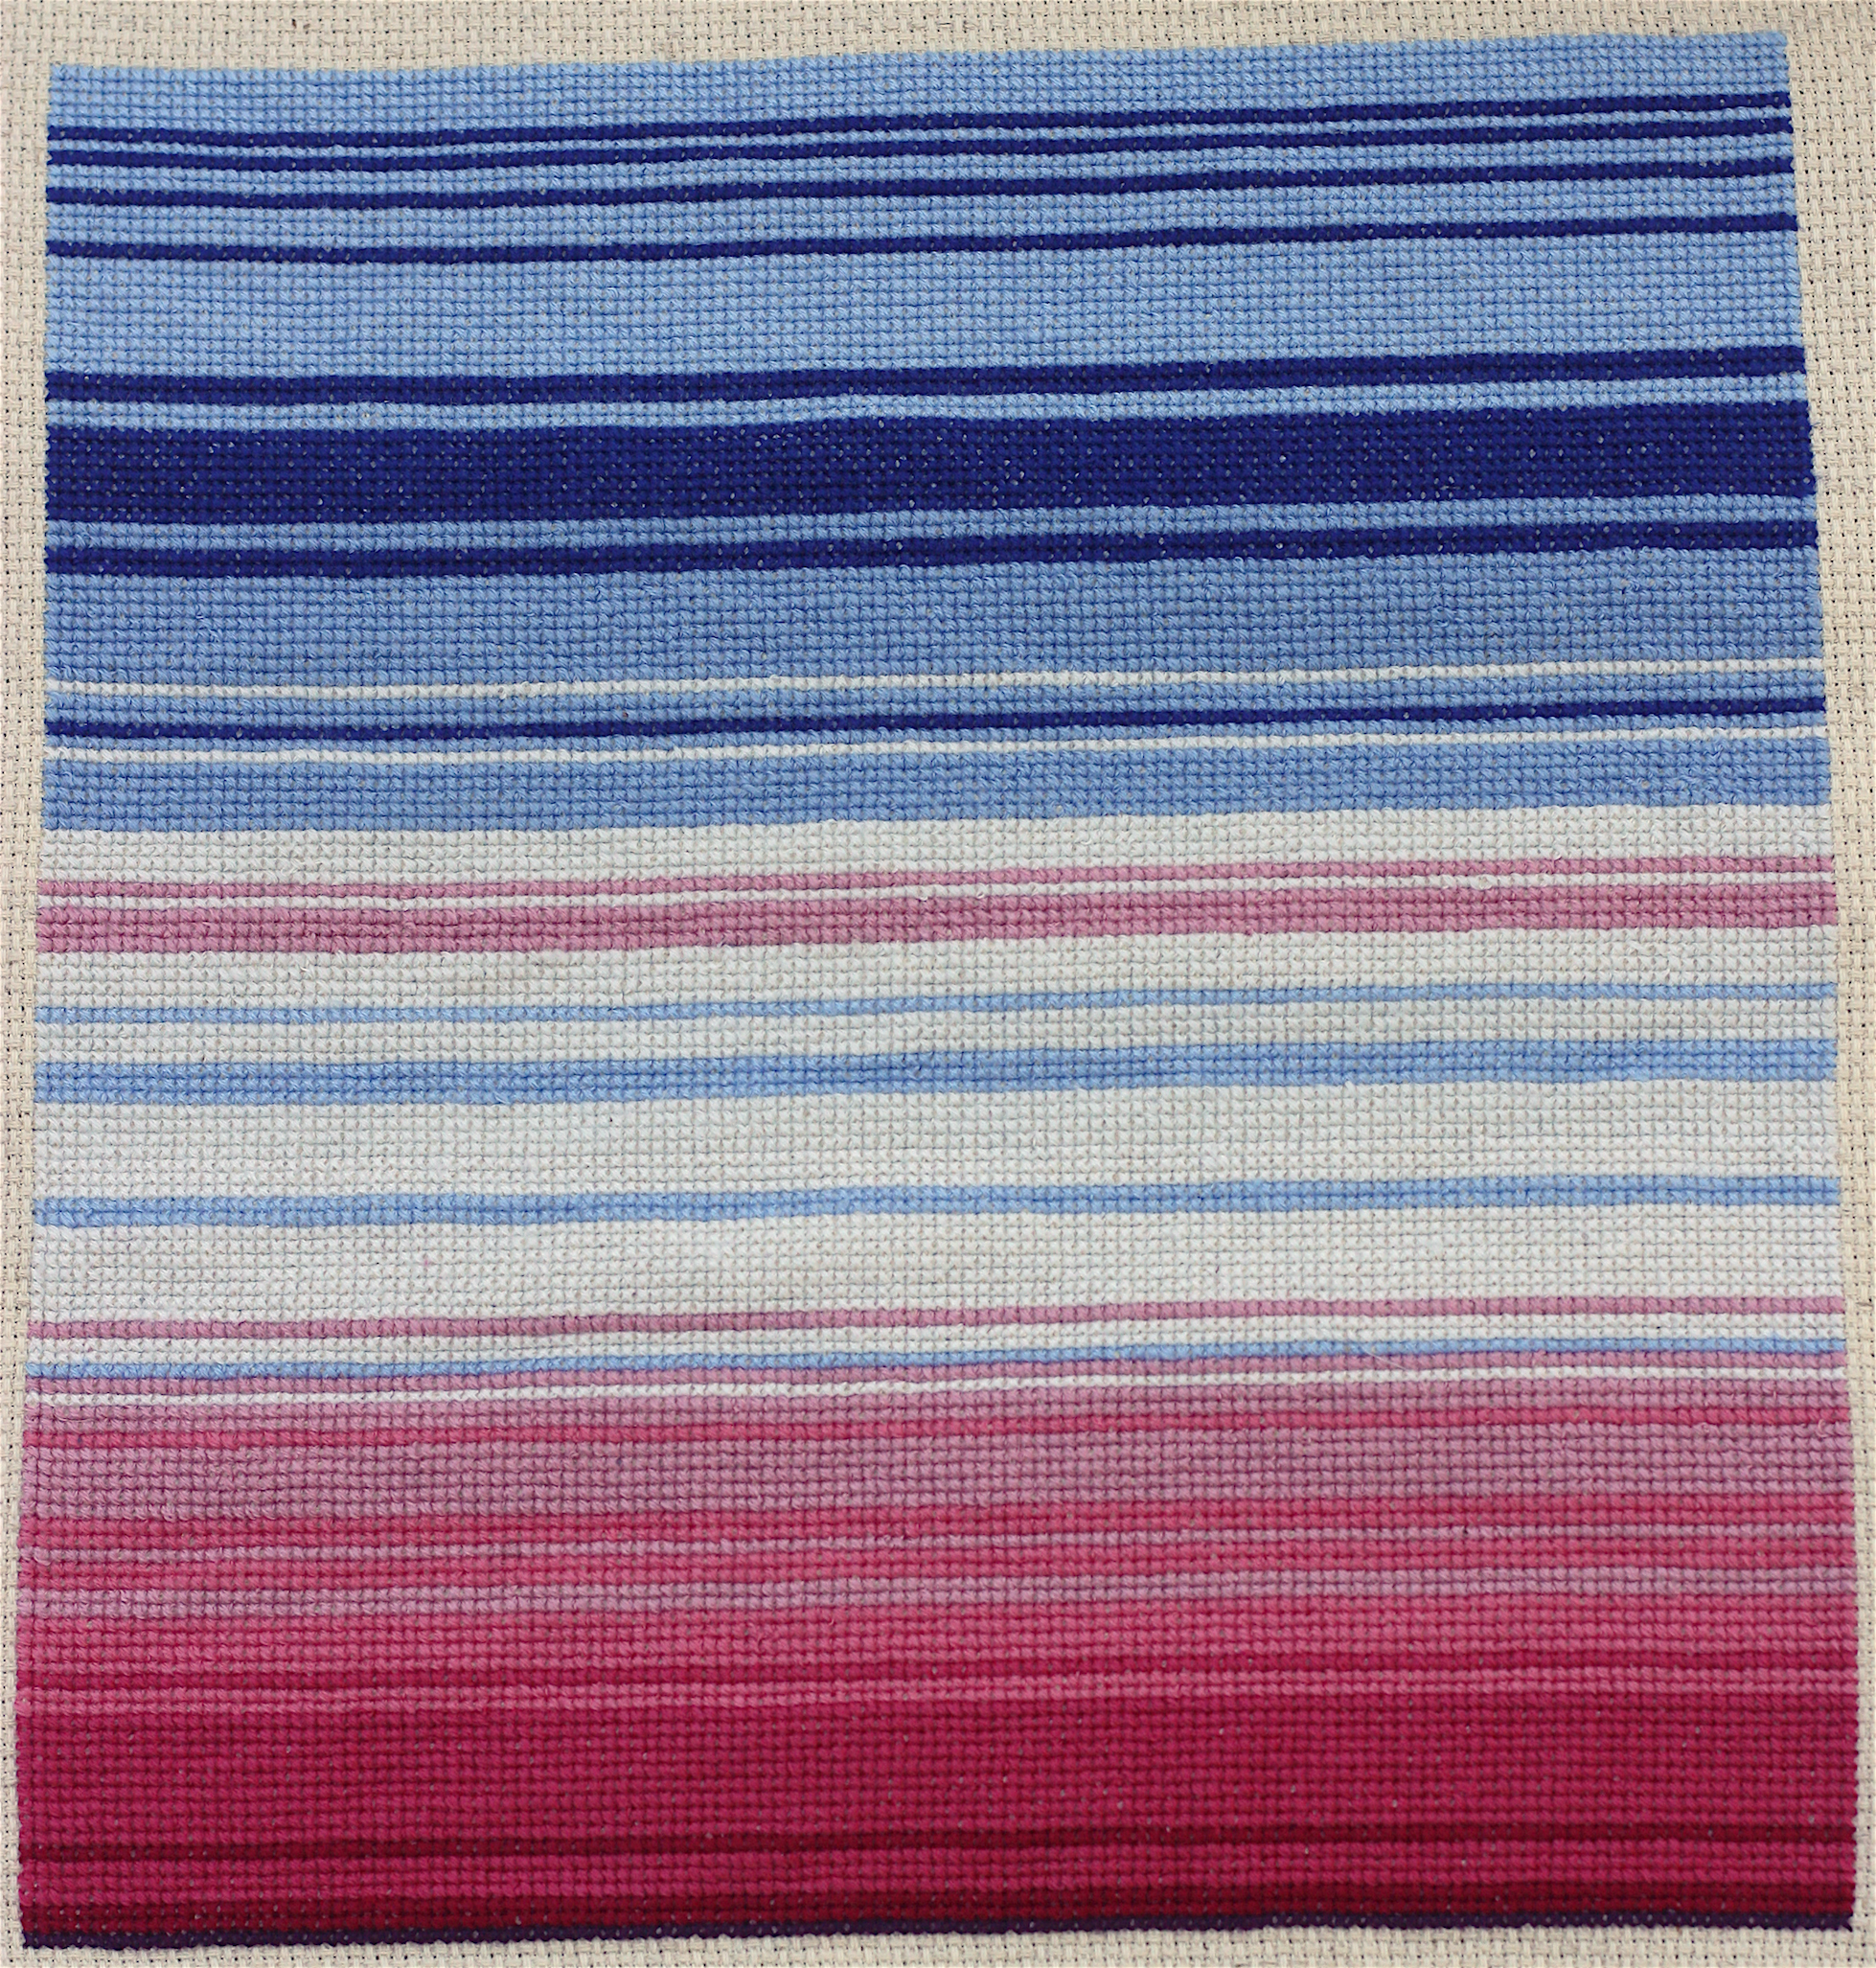
Climate Change Cross Stitch by Ellie White
Each row of this cross stitch represents the average temperature for that year. It starts from 1880 (top row) to 2017 (bottom row). White is the average temperatures of the years 1900 to 2000. The colors ramp up by 0.2 degree Fahrenheit in the red, and ramp down by 0.2 degree Fahrenheit in the blue. I had to go back to the yarn store because the last row required a deeper shade of red; that is, our climate is warming at an alarming rate!
-
CreditsEllie White
-
Award
-
Categories
-
See more


