Life of a Hashtag by Lilach Manheim
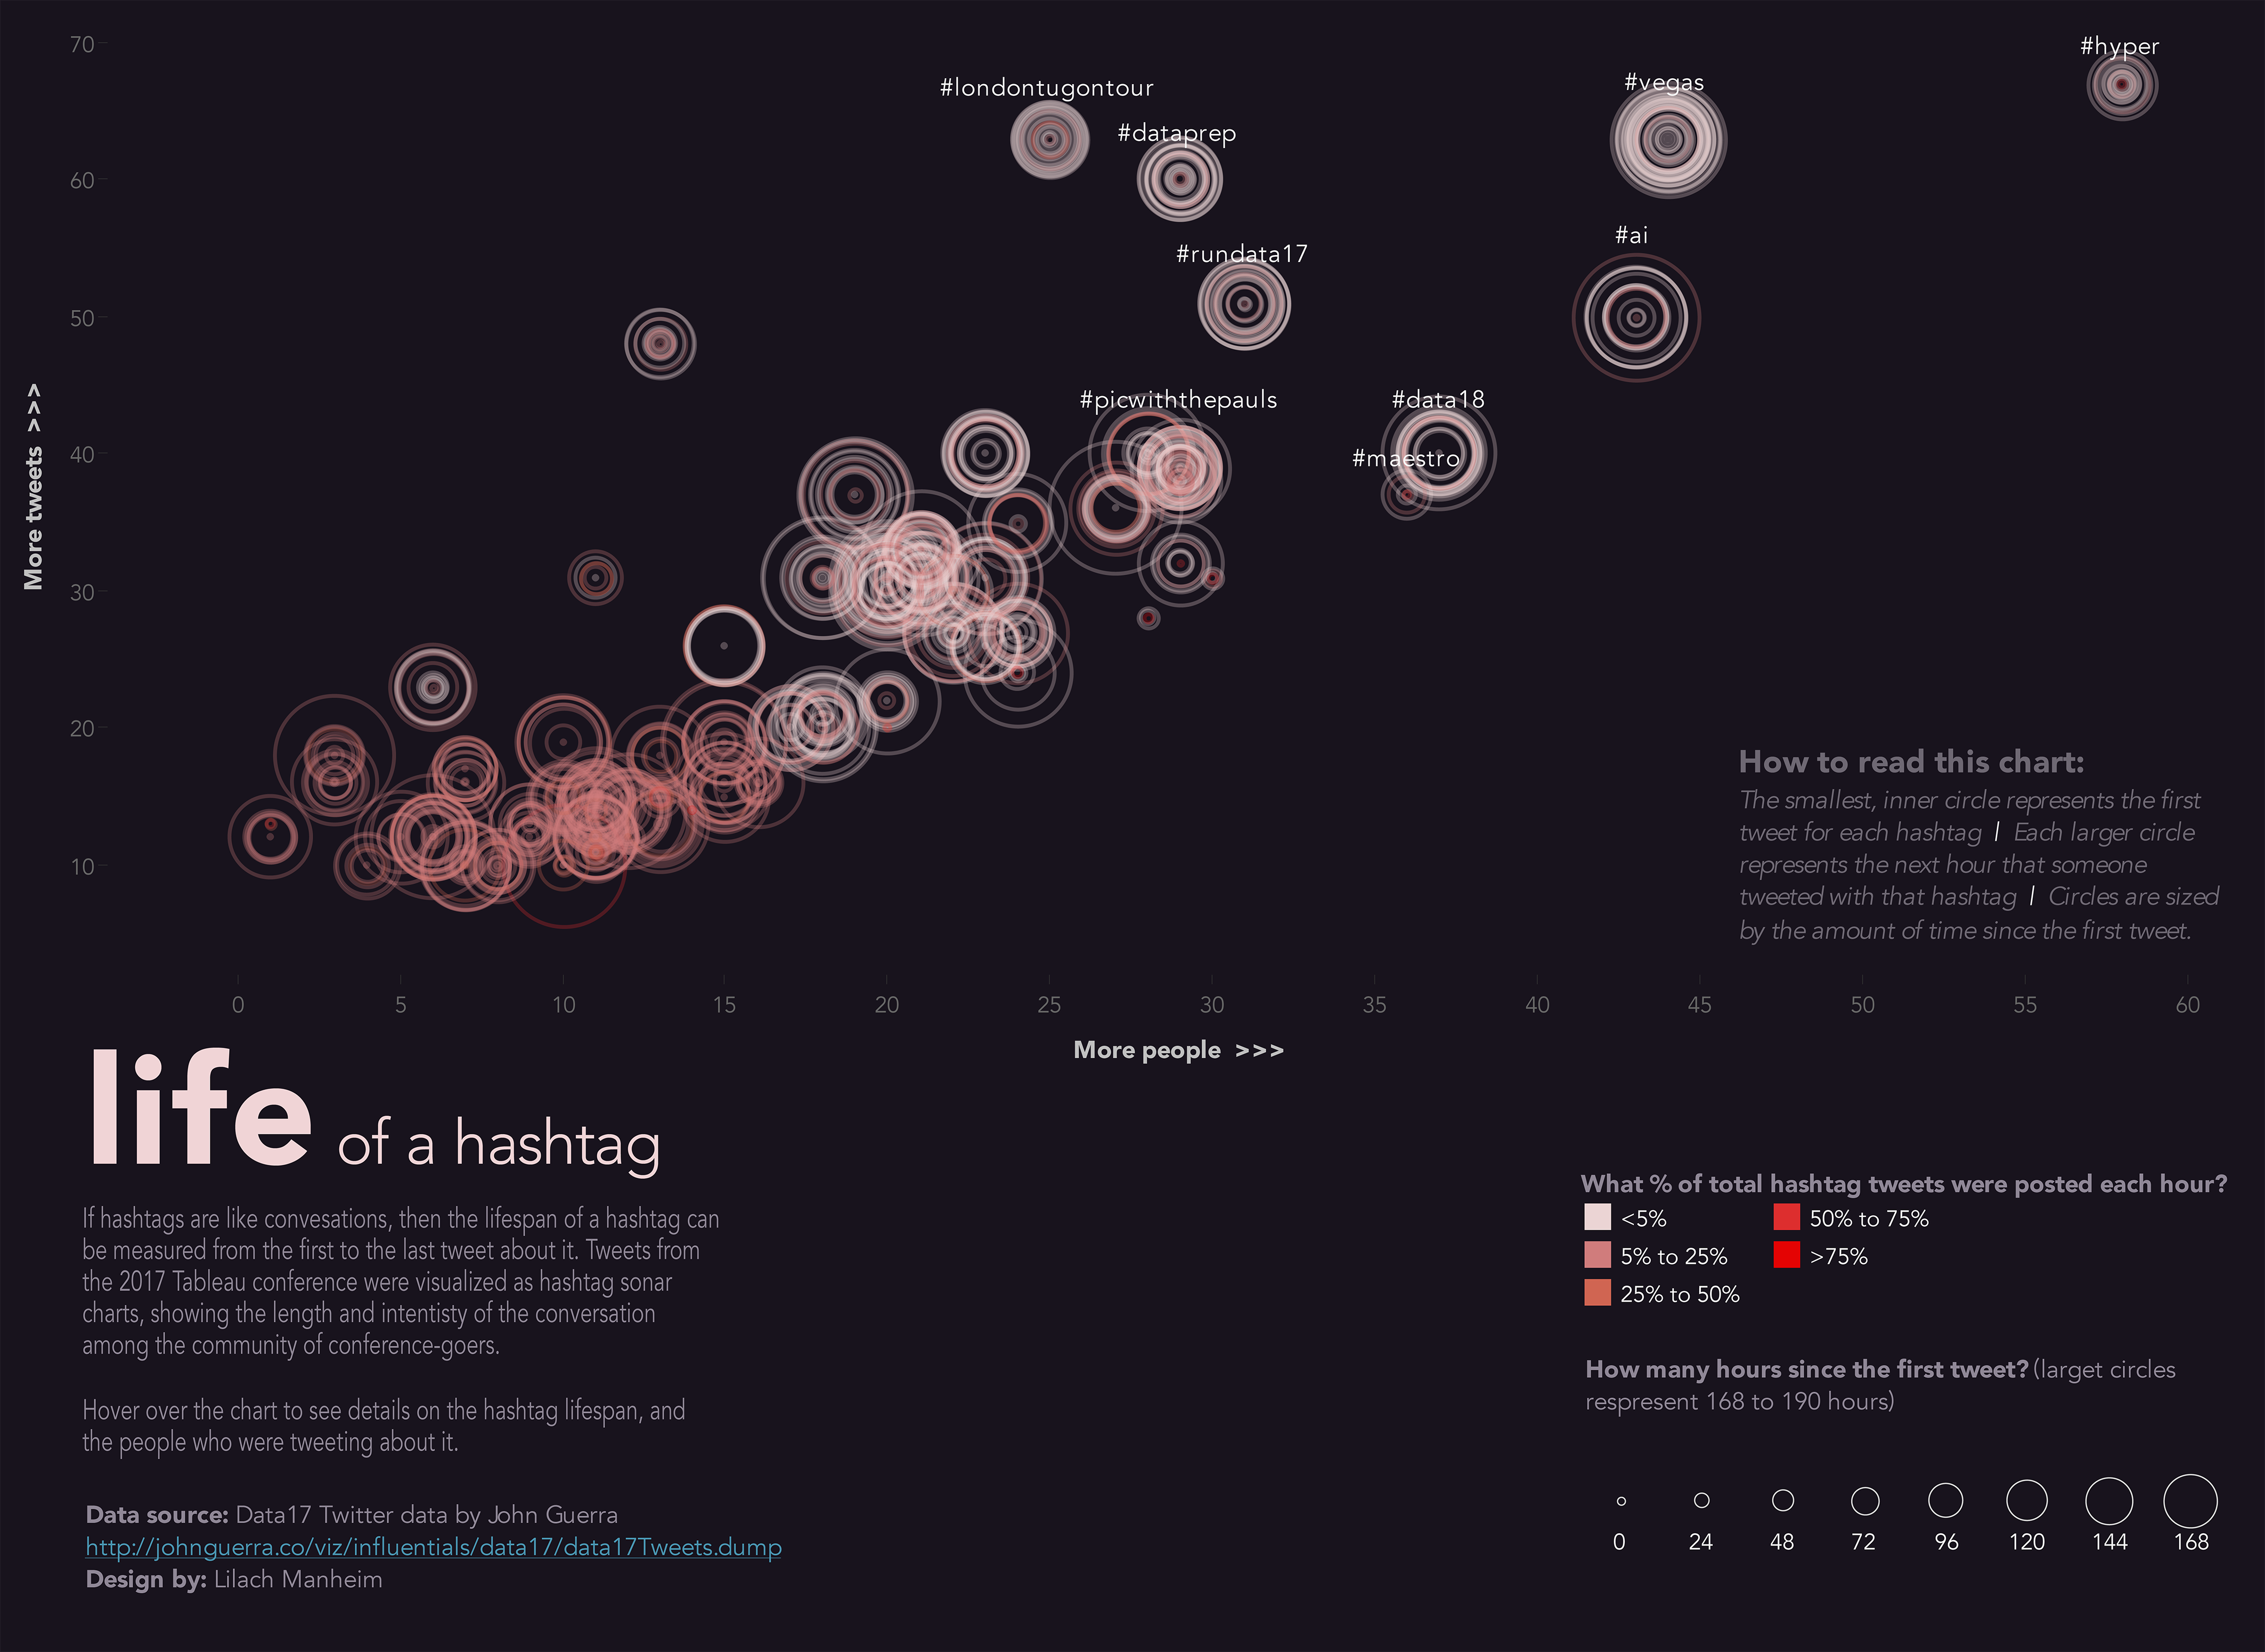
Exploration of the shape of hashtag conversations at Tableau's 2017 conference. The sonar chart type of each hashtag shows how the conversation evolved in each hour that someone tweeted about it, highlighting the intensity of a conversation: Did it start with a lot of tweets and then quickly fade out? Or did the conversation slow down more gradually?
Tooltips show a more detailed chart with a 'sonar' for each user, so it's easy to see if a hashtag had people who dominated the conversation.
-
CreditsLilach Manheim
-
Award
-
Categories
-
See more


