
How Did Your Neighborhood Vote? (An Extremely Detailed Map Of The 2018 Brazilian Elections) by Estadão
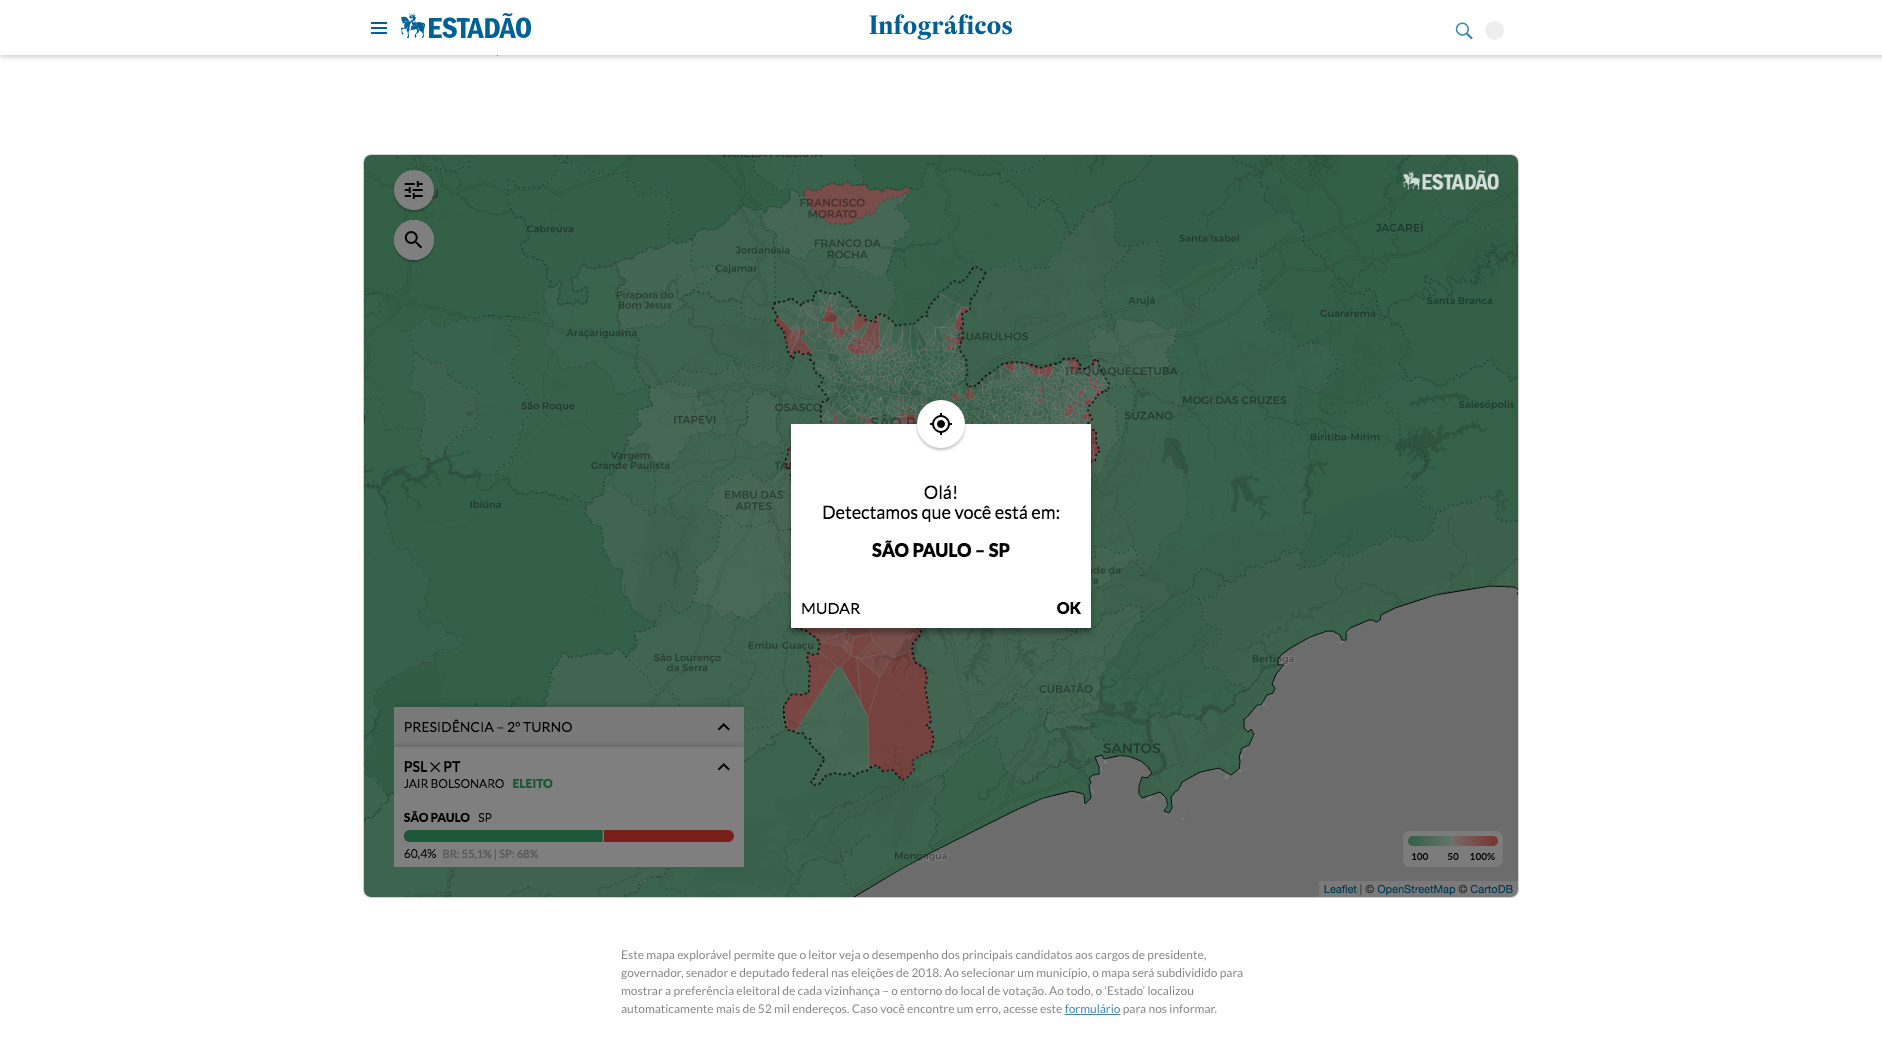
For the 2018 Brazilian general elections, our team developed a highly detailed results map, segmenting the electoral results by ballot location. This may seem trivial in countries where the state of open-data policies is more advanced, but the Brazilian electoral authorities don’t provide the geographic coordinates of most voting sections, only their addresses – and even this basic data is often too dirty to be used easily.
To overcome this, we spent months cleaning the database and geocoding around 52,000 locations. After that, which would already amount for an never-seen-before level of detail by itself, we decided to add another layer to our analysis.
Most people in the country vote in the ballot closer to where they live, a policy that is stimulated by the electoral registration officers. Due to that, we used the voronoi algorithm to approximate the ‘area of influence’ of each point – that is, we drew polygons upon the map, each one enclosing all the people who vote in a given place.
Having computed those areas, we were able to use census tracts data to approximate the demographic and socioeconomic characteristics of the people that voted in any place of the country.
The entrant has supplied multiple files for this project:
-
CreditsRodrigo Menegat; Bruno Ponceano; Ariel Tonglet; Vinicius Sueiro; Daniel Bramatti
-
Award
-
Categories
-
See more


