The State Of The States by Soak Digital Ltd
Our team of digital strategists, technology experts, and creatives work collaboratively to bring data to life through immersive storytelling. We constantly challenge conventional thinking for our clients, creating powerful solutions to remove complexity and deliver a wide variety of data visualisation tools.
Over a relatively short period, our data solutions have evolved as one of the 4 core pillars of what we do here at Soak Digital, allowing us to work with internationally recognised brands using data visualisation and technology; making their data consumable, functional and always with aesthetics in mind.
When Donald Trump became the 45th president of the USA, The London School of Economics (LSE) felt an understanding of trends in specific US states was needed to help predict future developments.
Soak were asked to build the interactive aspects of the website – creating an apolitical, online resource portal- giving in-depth information for anyone interested in exploring the political landscape of America; with more than 2,500 pieces of data as provided by LSE. The achieved aim was to make the portal as user-friendly as possible, for those with no knowledge of US politics through to avid experts, journalists and commentators.
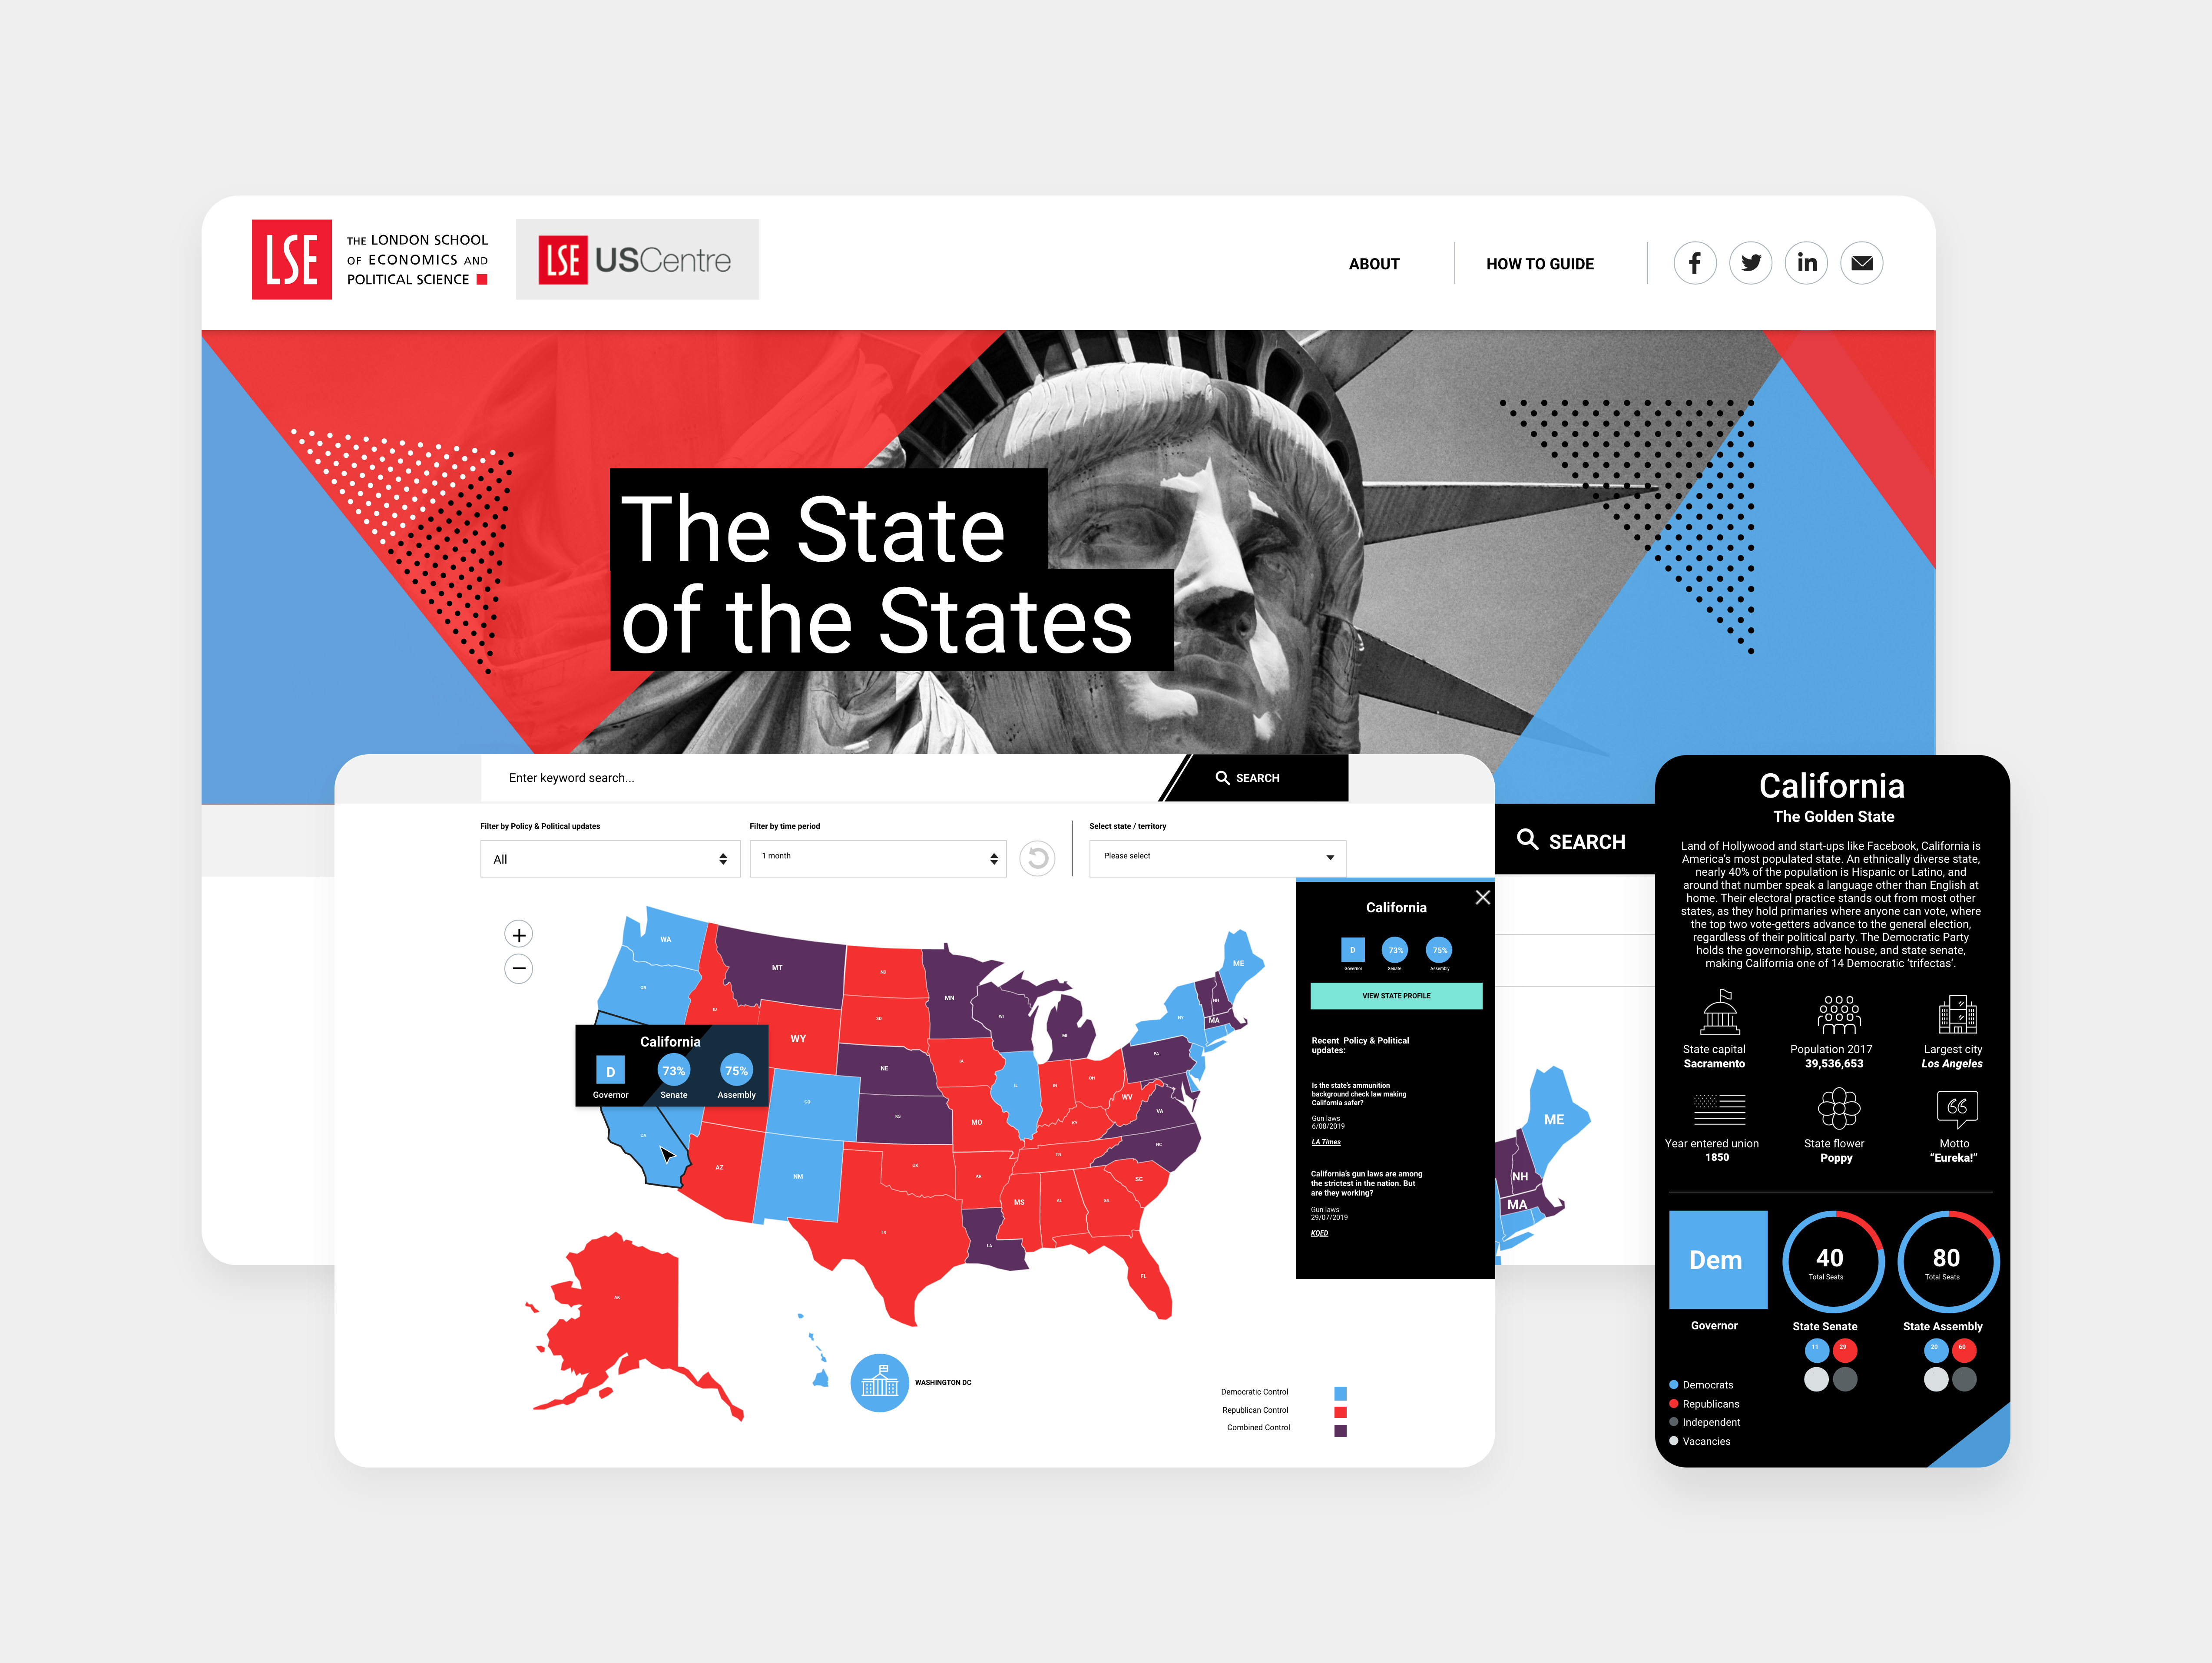
Landing on the main page allows users access to a menu listing various policy areas from abortion to work and trade unions. Clicking on a policy area will highlight the states which have recent data updates in that region of the USA.
Users can then access a profile of each state with easily surfaced, comprehensive stats and data on political make up, to policies ranging far and wide: cannabis, capital punishment, legislative and gubernatorial control and details, as well as recent and upcoming elections.
Each state is colour-coded to show when there is unified government, i.e. when either the Democratic or Republican Parties hold the state’s Governorship, House and Senate. Red for Republican control, and blue for Democratic control. Mixed control is denoted by purple.
Users can review past politics and policy updates from that state, organised by month, and policy-area keywords. Clicking on an individual state highlights the state and shows a pop-up dialog listing the most recent three politics and policy updates from that state (plus the source) Users can then click through to view the originating blog post or article if they so desire. These updates are also shareable via social media.
Awarded with a prestigious 2019 Guardian University Award in the digital innovation category, the project has also been such a success with audiences globally, that it has become the blueprint for similar interactive resources ahead of the Indian elections in 2019 and a model for a future global electoral interactive overview being planned by the university’s government department.
“Soak were fantastic partners for our State of the States project. They perfectly understood our vision for the project but also suggested new and effective designs for the data that we wanted to show”
~ Mr Chris Gilson - Managing Editor, LSE USAPP Managing Editor, LSE USAPP
-
CreditsSoak Digital Ltd
-
Award
-
Categories
-
See more


