The Shortlist: Visualization & Information Design
As a dataviz fan, you've come to the right place. We have a blog on the making of better charts, tools for selecting the best visual for the job, and games that will help keep your graphic identification skills sharp. It's all here in our 'Visualization & Information Design' category.
Charticulator: Interactive Construction Of Bespoke Chart Layouts
By Donghao Ren, Bongshin Lee, Matthew Brehmer, Nathan Evans, Kate Lytvynets, David Tittsworth & Chris Trevino at Microsoft Research
Match It Game
By Jonathan Schwabish & Severino Ribecca (https://datavizcatalogue.com)
Polyarea Chart
By Alex Katona
From Data to Viz
By Conor Healy & Yan Holtz
Pixel Chart
By Andrei Kaschcha
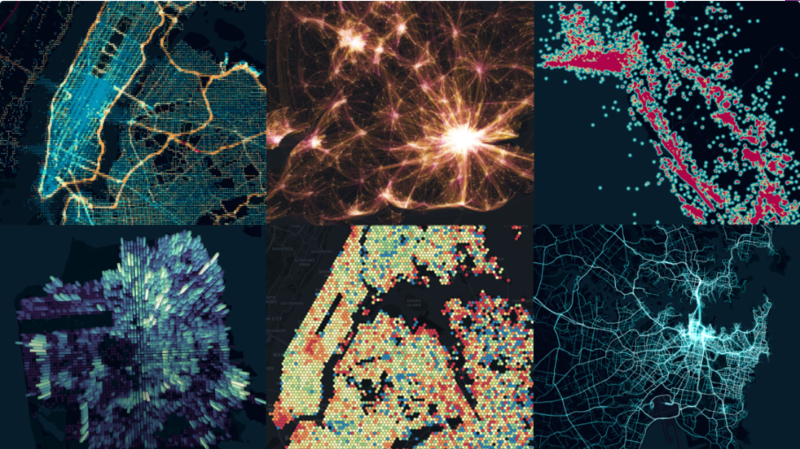
Kepler.gl
By Shan He, Giuseppe Macri, Chris Chua, Abhishek Gupta & Shan He
Diagrammm
By Roman Sverdan
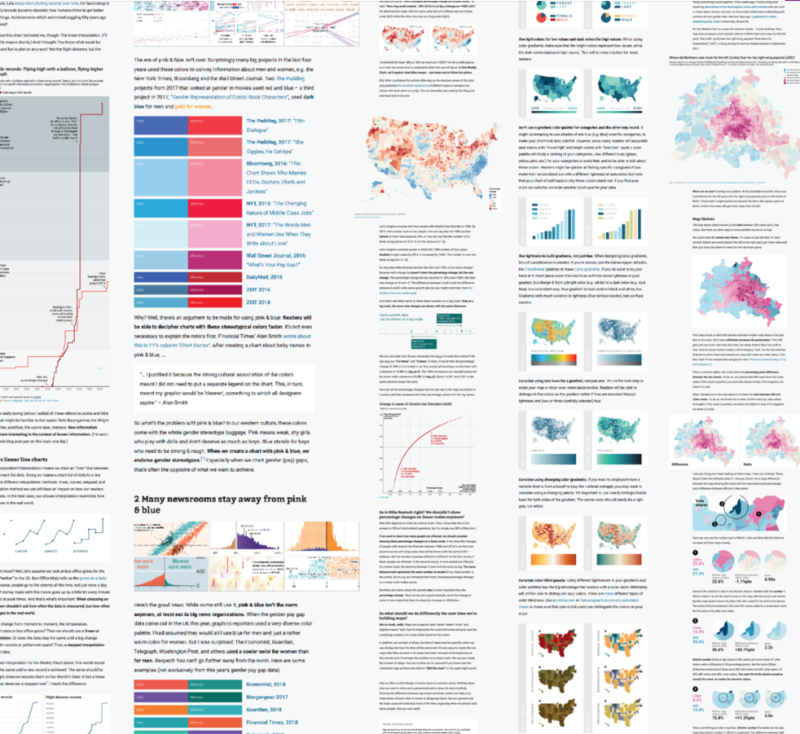
Chartable. A Blog by Datawrapper.
By David Kokkelink, Mirko Lorenz, Gregor Aisch, Ivan Lokhov, Anna Thieme, Lisa Charlotte Rost, Hendrick Bartush, Elana Levin Schtulberg & Hans Hack at Datawrapper
:: See the Full 2018 Shortlist
Discover each category:
Visualization & Information Design
I'm shortlisted - what happens next?
We've emailed all shortlisted entrants with next steps including invites to the NYC ceremony, taking place the evening of Tuesday, 4th December. If you're shortlisted but haven't heard from us by 11.59 (PST) Fri 12 Oct, it's probably because we don't have up-to-date contacts for you – so drop us a line.
Not shortlisted but want to find out the results live - and brush shoulders with the winners - at the NYC ceremony? We’re making available a limited number of tickets (including canapés and a welcoming drink) - book here.
Want us to change the image / text / credit / link? Have other questions? Check the housekeeping notes here before emailing us with your query.
:: Browse the 2018 Longlist & Shortlist
:: See the 2017 winners


