How Much Warmer Is Your City? by BBC News Visual & Data Journalism
The world is getting hotter. July 2019 was one of the warmest months ever recorded - and July temperatures almost everywhere on Earth have been higher in the last decade compared with 1880-1900. The BBC Visual and Data Journalism team explored how the temperature has changed in 1,000 major cities across the world how much it could increase by in the coming years in a compelling, animated, visual scrolling web experience.
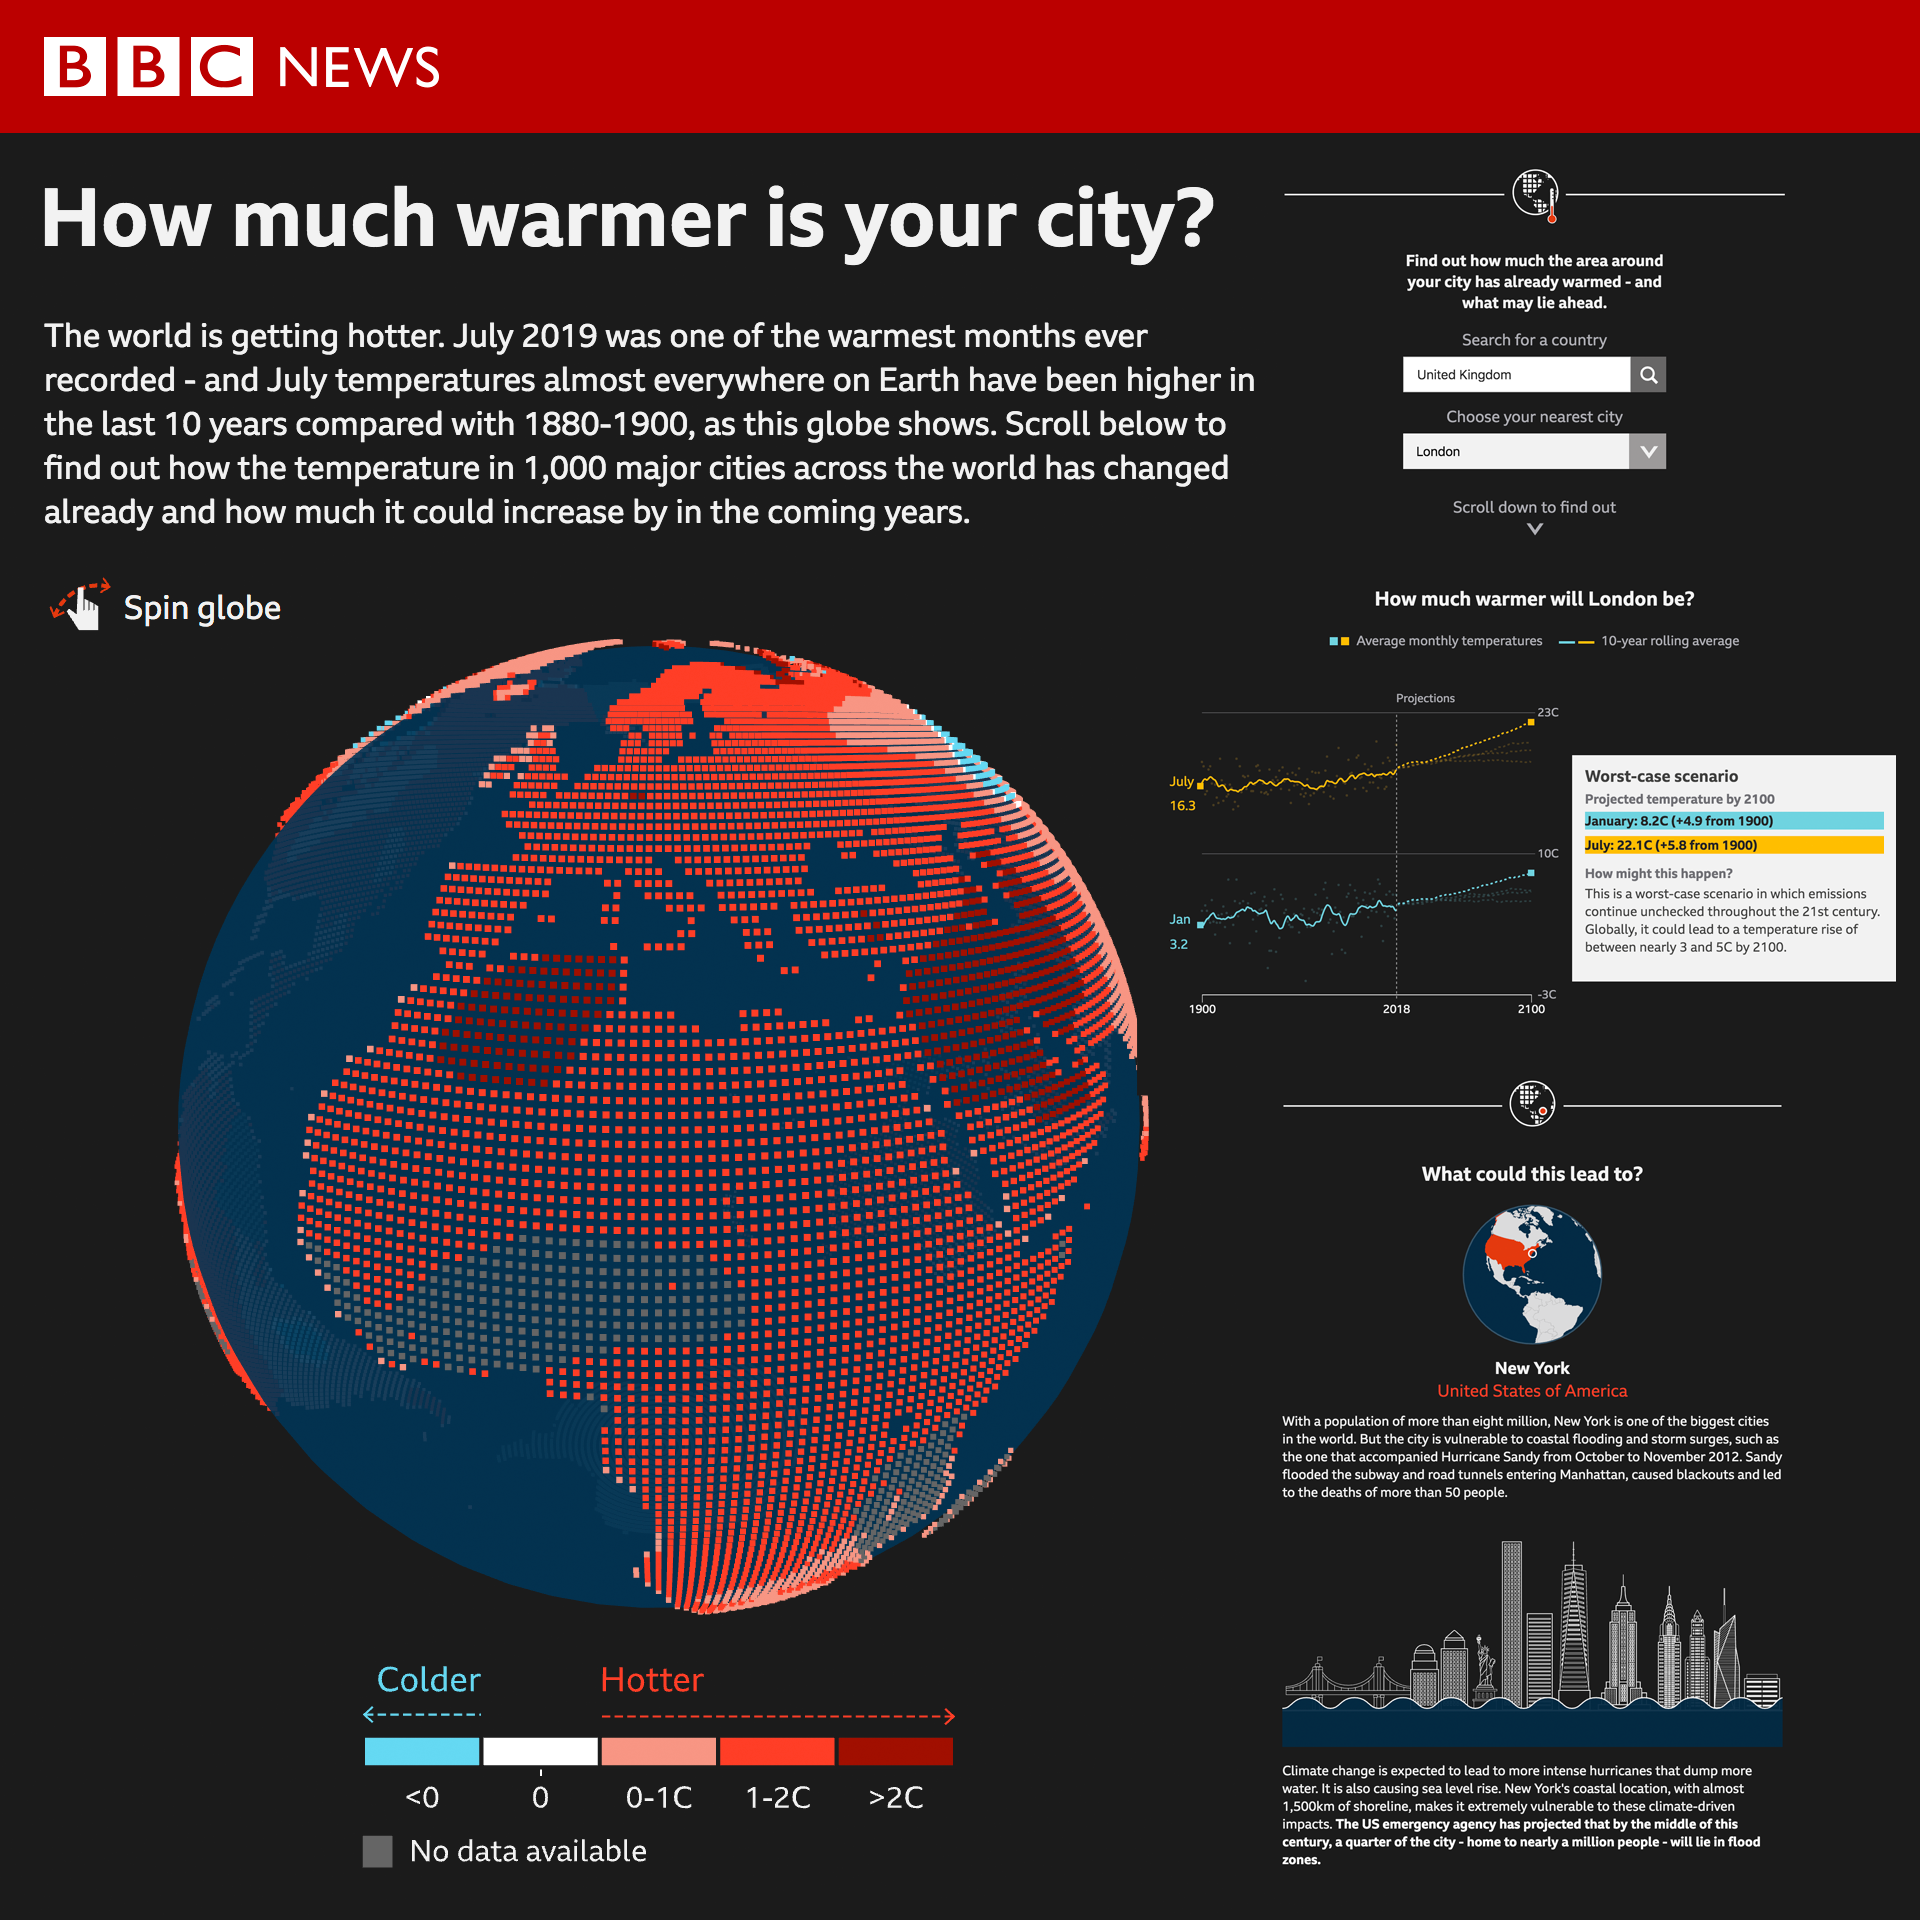
A spinning globe at the top of the page visualises how July temperatures have changed already in the past 100 years, with an interactive search lookup below allowing the audience to find out how much the area around their city has already warmed and what may lie ahead.
What is unique to this project is how it goes beyond analysing and visualising global average temperatures and rises of 1.5C and 2C. In doing so, the piece visualises changes in actual temperatures for January and July, which for many locations represent the height of summer and winter. These figures are more relevant and relatable to the audience rather than the global average.
The story also goes on to look at the potential impact of climate change on three very different locations: the Indonesian megacity of Jakarta, the US state of New York, and the Arctic.
The team worked hard to ensure that the page was accessible to all users, carrying out testing internally before launch. The testing included checking the content using a screen reader, as well as implementing an animation toggle at the top of the page to enable readers with vestibular impairments to turn off the animations.
The BBC's data journalists worked closely with climate scientists to develop the methodology for the data analysis and ensure it was statistically and scientifically accurate.
The project was translated into 27 languages and promoted across different BBC World Service language sites such as Hindi, Swahili, Arabic, Korean and Russian.
-
CreditsDesign by Prina Shah and Irene de la Torre Arenas. Development by Alexander Ivanov and Becky Rush. Written and produced by Nassos Stylianou, Clara Guibourg and Paul Rincon. Help with the methodology and data analysis was provided by Zeke Hausfather at Carbon Brief, Karsten Haustein and Friederike Otto at the University of Oxford Environmental Change Institute
-
Award
-
Categories
-
See more


