
Dataset which captures diverse purchasing behaviors by analyzing key demographics such as age, gender, region, education, and income. It also includes vital insights into purchase amounts, buying...
-
 View projectA time-series visualization on the finish times for the Runners group of the 2024 Boston Marathon. Viewers can filter by entered gender and search for a runner by name to highlight them on the chart
 -
 View projectData visualization project for Al Majalla magazine, published in September 2024. This visualization consists of five data sets, each presented in a dynamic and organic way. The design aimed to...
 -
 View projectThis journalistic investigation is an innovative integration of cross-border journalism, data analysis and digital storytelling. It delves into European citizenship processes and exposes systemic...
 -
 View projectThis print infographic captures the movement patterns of various animal species, showcasing their behaviors and migrations over time. It distills complex tracking data into an accessible format,...
 -
 View projectWomen, Money, & Politics Watch 2024 is a dynamic data visualization platform created by Graphicacy for The Center for American Women and Politics (CAWP) to track campaign financing during the...
 -
 View projectFor the launch of Scena9’s 2024 print issue themed “mistake,” we developed a 5x3m wall print to visualize an article on addiction in Romania. The project aimed to address the scarcity of reliable...
 -
 View projectUsing an exclusive dataset of 1.7 million car listings, this interactive reveals how vehicle colors went from a rainbow of options to a sea of gray. To assemble our database, we looked at all car...
 -
 View projectDuring the hottest days of each summer, the infographics desk in news media usually delivers pieces explaining how hot is the summer and how all the records have been surpassed, mainly due to...
 -
 View projectThis visualization is based on the systematic review and meta-analysis "Sleep characteristics across the lifespan in 1.1 million people from the Netherlands, United Kingdom, and United States." It...
 -
 View projectThis graphic illustrates the disproportionate impact of family and domestic violence on Aboriginal and Torres Strait Islander people. In 2021-22 - the latest data available - Indigenous women aged...
 -
 View projectThis dashboard provides an in-depth analysis of crime trends in Atlanta from 2009 to 2020, focusing on the most common offenses reported to the Atlanta Police Department. Visualizing yearly...
 -
 View projectEverything Everywhere All At Once (EEAAO) won the Academy Award for Best Picture in 2023, resonating deeply with audiences across nationalities, genders, and languages. The A24 sci-fi film explores...
 -
 View projectLove Is Blind is a Netflix reality series where participants speed-date and get engaged without seeing each other, then spend a few weeks together before their wedding, trying to decide whether to...
 -
 View projectThe mission of Climate Interactive is to create and share tools that drive effective and equitable climate action. We make climate science accessible to inform climate policy and corporate...
 -
 View projectThis dashboard has been designed as a collaboration between HereWeGrow, a German non-profit organization dedicated to improving the livelihoods of coffee farmers and their families, and Enveritas,...
 -
 View projectThis visualization explores the global toll of natural disasters from 1900 to 2020, providing a comprehensive analysis of deaths by region, disaster category, and country. It highlights trends over...
 -
 View projectThe work attempts to put a fashion perspective to Formula 1. Picture a world where F1 cars and pilots aren’t just fast – they’re runway-ready, judged on their dimensions, curves and performance...
 -
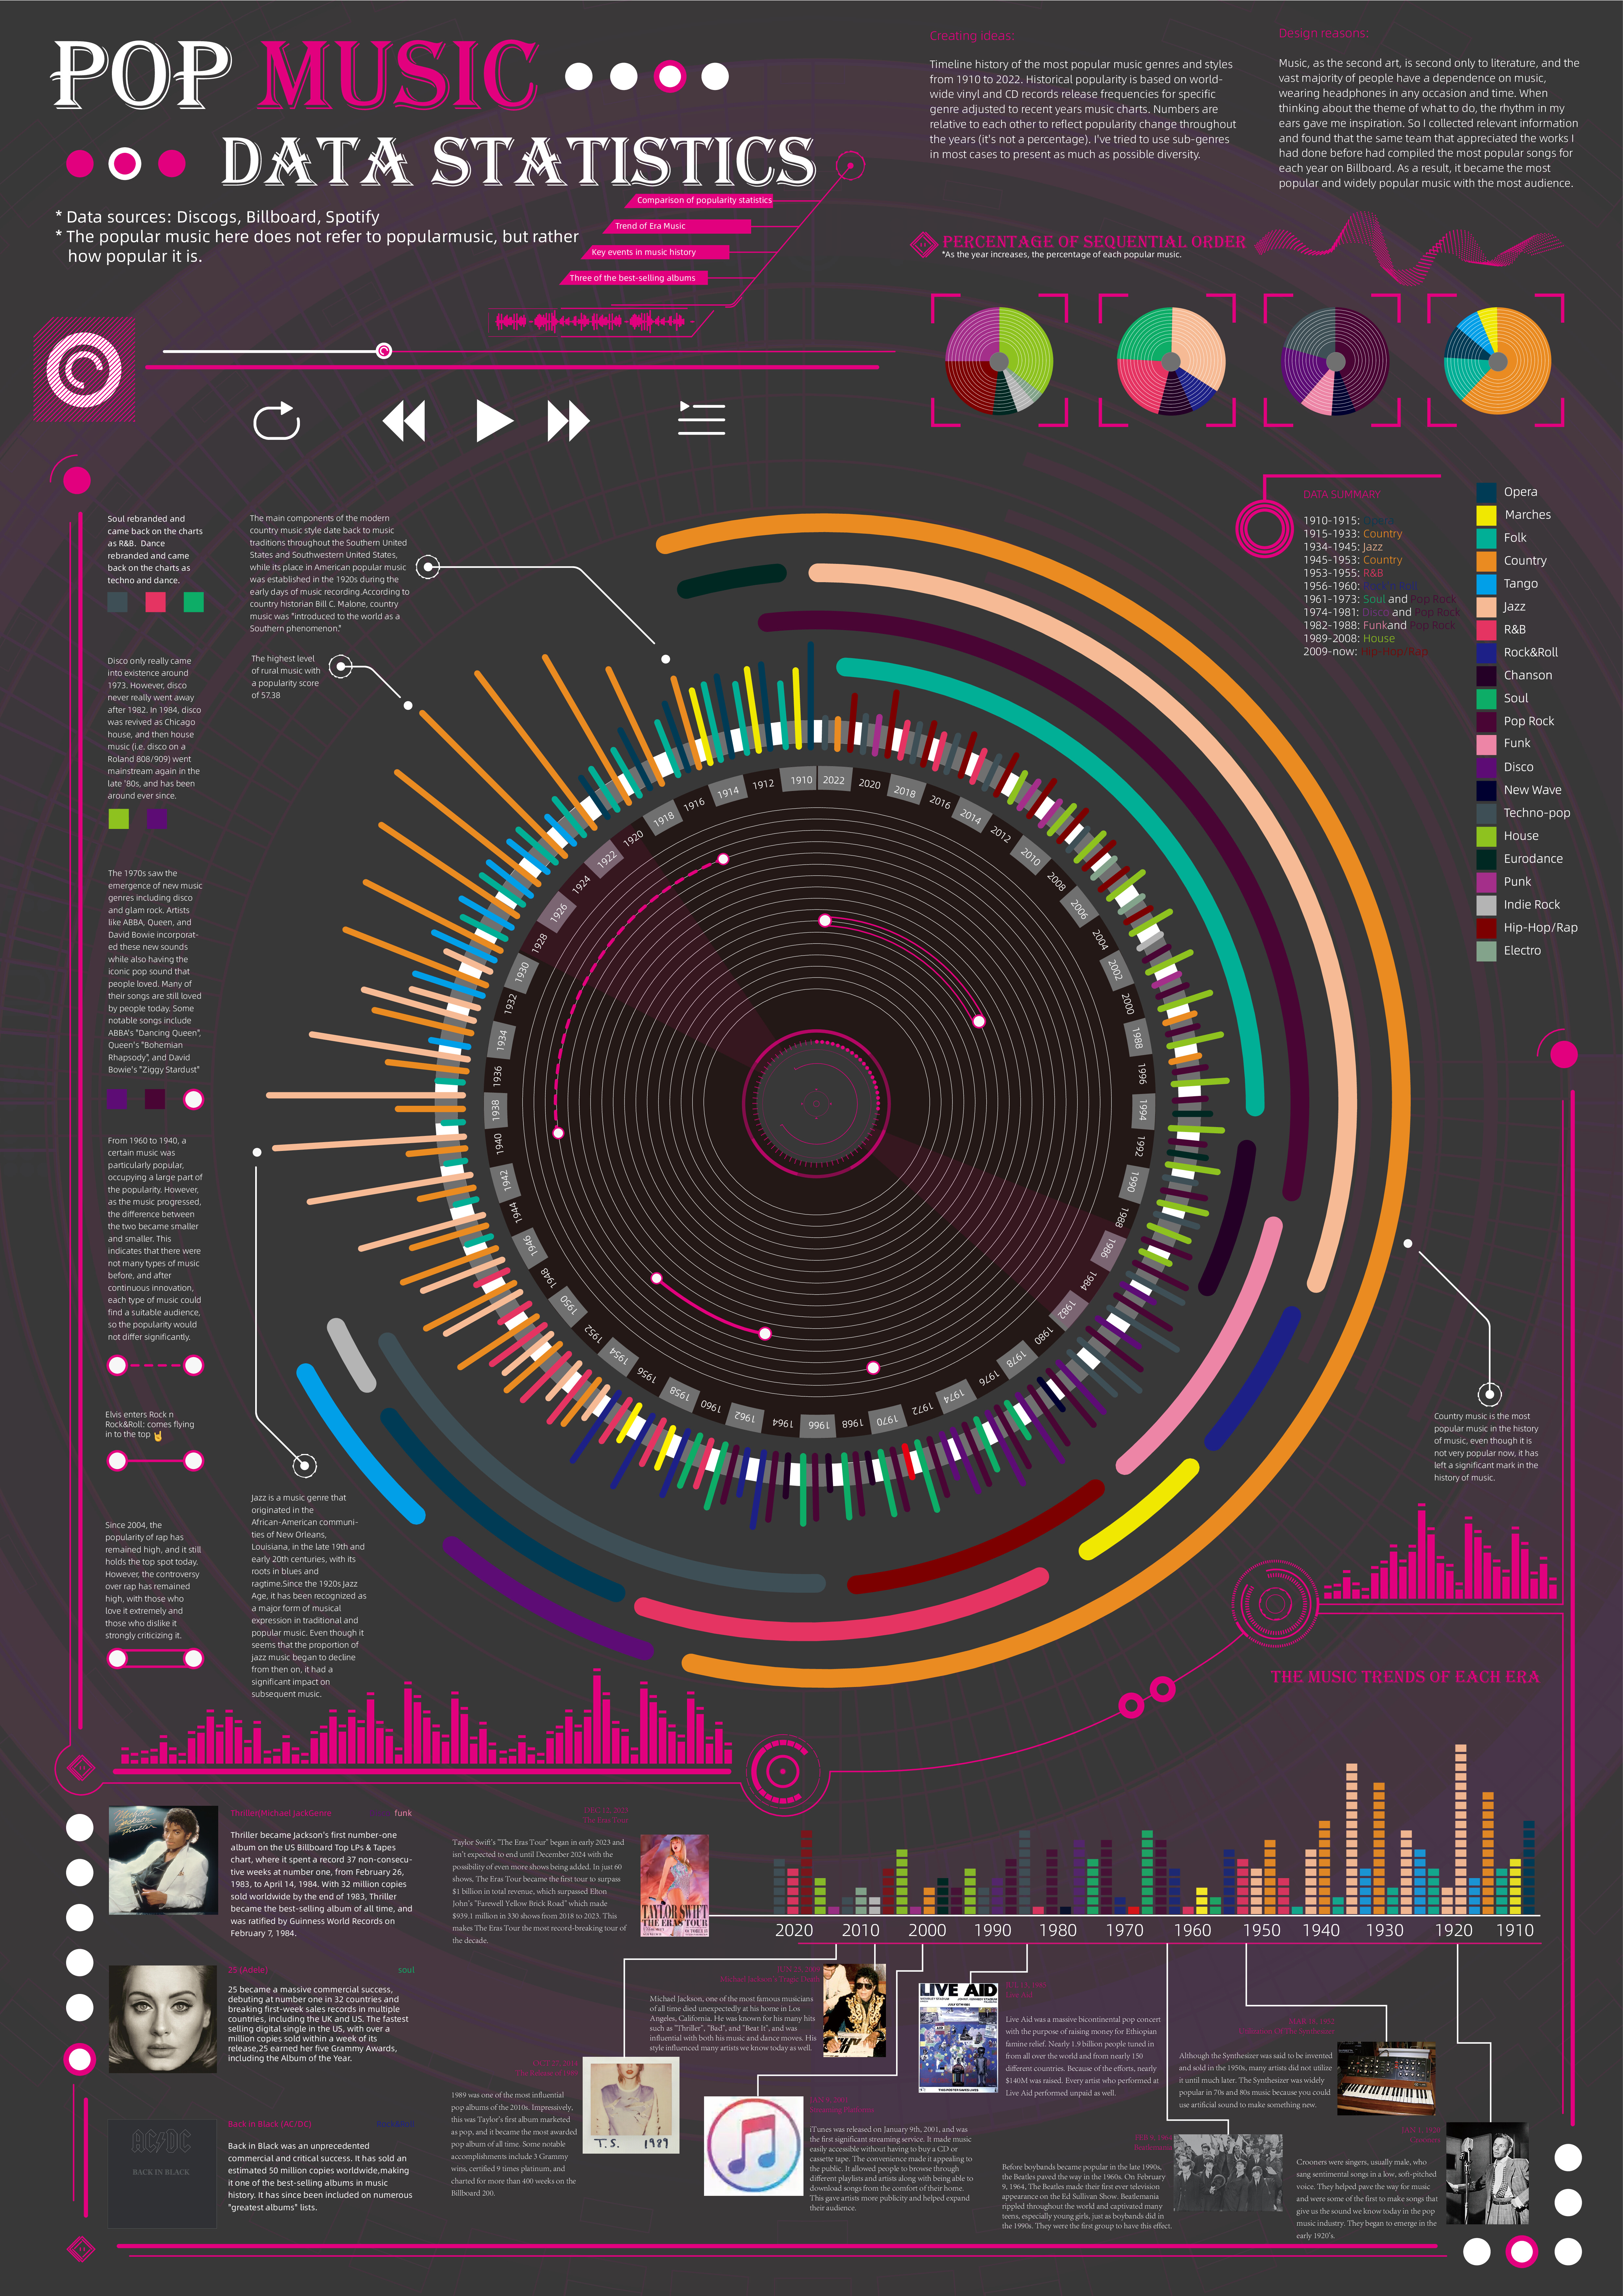
 View projectTimeline history of the most popular music genres and stylesfrom 1910 to 2022.Historical popularityis based on world-wide vinyl and CD records release frequencies for specificgenre adjusted to...
 -
 View projectThe first handbook in Hungarian language on the theory and practice of data visualization. In addition to the many international works, the book presents mainly old and contemporary visualizations...
 -
 View project"DataVase" is a ceramic design project that combines data visualization and artistic expression to present Romania's demographic changes from 1970 to 2020. This vase serves as a physical narrative,...
 -
 View projectThis visualisation shows the lighthouses of the Arctic Circle. The visualisation is created using the free and open-source R statistical computing language, which makes it accessible and...
 -
 View projectChina’s demand for a traditional medicine known as e-jiao is fueling the slaughter of millions of donkeys every year, according to animal welfare groups and veterinary experts. E-jiao, which is...
 -
 View projectThe healthcare industry has seen an alarming rise in data breaches. 2023 has been considered the worst year so far in US healthcare with 160 million healthcare records exposed. The largest...
 -
 View projectThis deep dive unravels the surprising partnerships and hidden profits behind the machine of parking enforcement in the United States. The project is part of a collaboration between researchers...
 -
 View projectI had long wanted to devote more time to Data Art but found myself stuck in endless planning. I realized Data Art bridges two worlds: offering creative practice for data-minded individuals and data...
 -
 View projectBeads have been used as a form of currency throughout history, and women often use jewelry as powerful symbols of their authority in male-dominated spaces (think power pearls, RBG). For these...
 -
 View projectThis newspaper design is based on a specific time period: 2019-2022 (i.e. the covid-19 pandemic period), and focuses on the development of clean energy during this four-year period. It is hoped...
 -
 View projectThe poster is dedicated to a personal trip to an art park with landscape installations. Art objects are located in the open air, harmoniously coexisting with nature. I went to Nikola-Lenivets in...
 -
 View projectDo we share fake news because we overestimate our understanding of the world and our ability to detect misinformation? Do we believe we know more than we actually do? The interactive and highly...