
Each season in Formula 1 features the Constructors' Cup. Teams earn points based on their performance in each race. Thus, in addition to individual standings, F1 also sees competition between...
-
 View projectThe Unspoken Project is comprised of two main deliverables—a publication piece, and an abridged data visualization—which address how the historical evolution of hidden symbols and signalling among...
 -
 View projectAn interactive data narrative spotlighting on the the devastating effect of Bottom-Trawlers, resulting in overfishing and loss in the marine ecosystem in India. Bottom trawling gear method is one...
 -
 View projectDataset which captures diverse purchasing behaviors by analyzing key demographics such as age, gender, region, education, and income. It also includes vital insights into purchase amounts, buying...
 -
 View projectIn a world that produces enough food to nourish its 7.95 billion people, millions still go to bed hungry. This paradox is not caused by a lack of resources, but by deep-seated inequalities and...
 -
 View projectData visualization project for Al Majalla magazine, May 2024. This project highlights key insights about the social network X, featuring a central Bubble Chart as the main visual focus....
 -
 View projectThis is a poster of pirated computer games currently available for download. While each dot, like a small star in the vast space of the gaming industry, represents the universe painstakingly and...
 -
 View projectWhile the critics are not saying that, Black Myth: Wukong remains one of the highest performers in the #videogames industry in 2024. This viz shows you the analysis behind sales performance, critic...
 -
 View projectThis animation of an “infinite map”—a “data dream”—depicts the density of restaurants in central Tokyo, with an imaginative twist: it’s morphed into a traditional Japanese ramen dish. This creative...
 -
 View projectThis visualisation shows the railways of Japan. The visualisation is created using the free and open-source R statistical computing language, which makes it accessible and reproducible. This is...
 -
 View project"A Year of Light" explores the evolution of the day-night cycle throughout the year and according to latitude. This visualization presents a luminous identity map of several cities around the...
 -
 View projectThis project showcases how survey data can be visualised in different ways. The first three pages represent the dashboard tiers that Yonder Data Solutions offers. These tiers are: 1) Overview:...
 -
 View projectThese miso jars transform recipe data into pottery itself. Each element of the material and form communicates: - Red clay on the lids maps fermentation time (1 circle = 1 year). - Tan clay...
 -
 View projectData visualization project for Al Majalla magazine. This project features two full-page visualizations for the article The Scramble for Africa, published in November 2023. Designed for both English...
 -
 View projectThis incredible project will immerse you in the wild world of the Chornobyl Zone. You can see and even hear the voices of animals and birds—from Przewalski's horses to the Ukrainian brook lamprey....
 -
 View projectExplore 7 years of my music listening data, which visualizes different aspects of my listening habits and music qualities over time. Click through the visualization to discover how my taste has...
 -
 View projectWhen police fail to follow operating procedures, the consequences can be deadly. The Review of New South Wales Police Force responses to domestic and family violence incidents, published in June...
 -
 View projectA title drop is when a character in a movie says the title of the movie they're in. "Full of Themselves" is a large-scale analysis of 73,921 movies from the last 80 years, exploring how often,...
 -
 View project"""Educational Offer in Mexico City"" is a data visualization project that analyzes the spatial distribution of preschools and primary schools in relation to demographic and socioeconomic factors....
 -
 View projectPew Charitable Trusts partnered with Graphicacy to modernize their Fiscal 50 platform, a decade-old resource tracking states' fiscal health through interactive visualizations. The redesigned site...
 -
 View projectData visualization project for Al Majalla magazine, August 2024. Inspired by the design of the euro banknote, this project simulates its texture, colors, and aesthetic while enriching it with key...
 -
 View projectPower-to-Trees Converter Button Pack In a place like Kentucky, where coal is deeply rooted in culture and identity, it’s easy to accept it as the norm. But as a generation passionate about...
 -
 View projectSome countries are experiencing an aging population, while others are in the midst of a baby boom. Some face unusual demographic shifts, while others remain surprisingly stable. This article...
 -
 View projectThis visualization explores the changing patterns of snow depth in Germany during Christmas from 1961 to 2023. It compiles data from 268 weather stations, showing the maximum recorded snow depth...
 -
 View projectRat Revolution is a striking human-sized light sculpture that brings New York City's rat population into sharp focus, intertwining art, data, and urban ecology. This physical data visualization...
 -
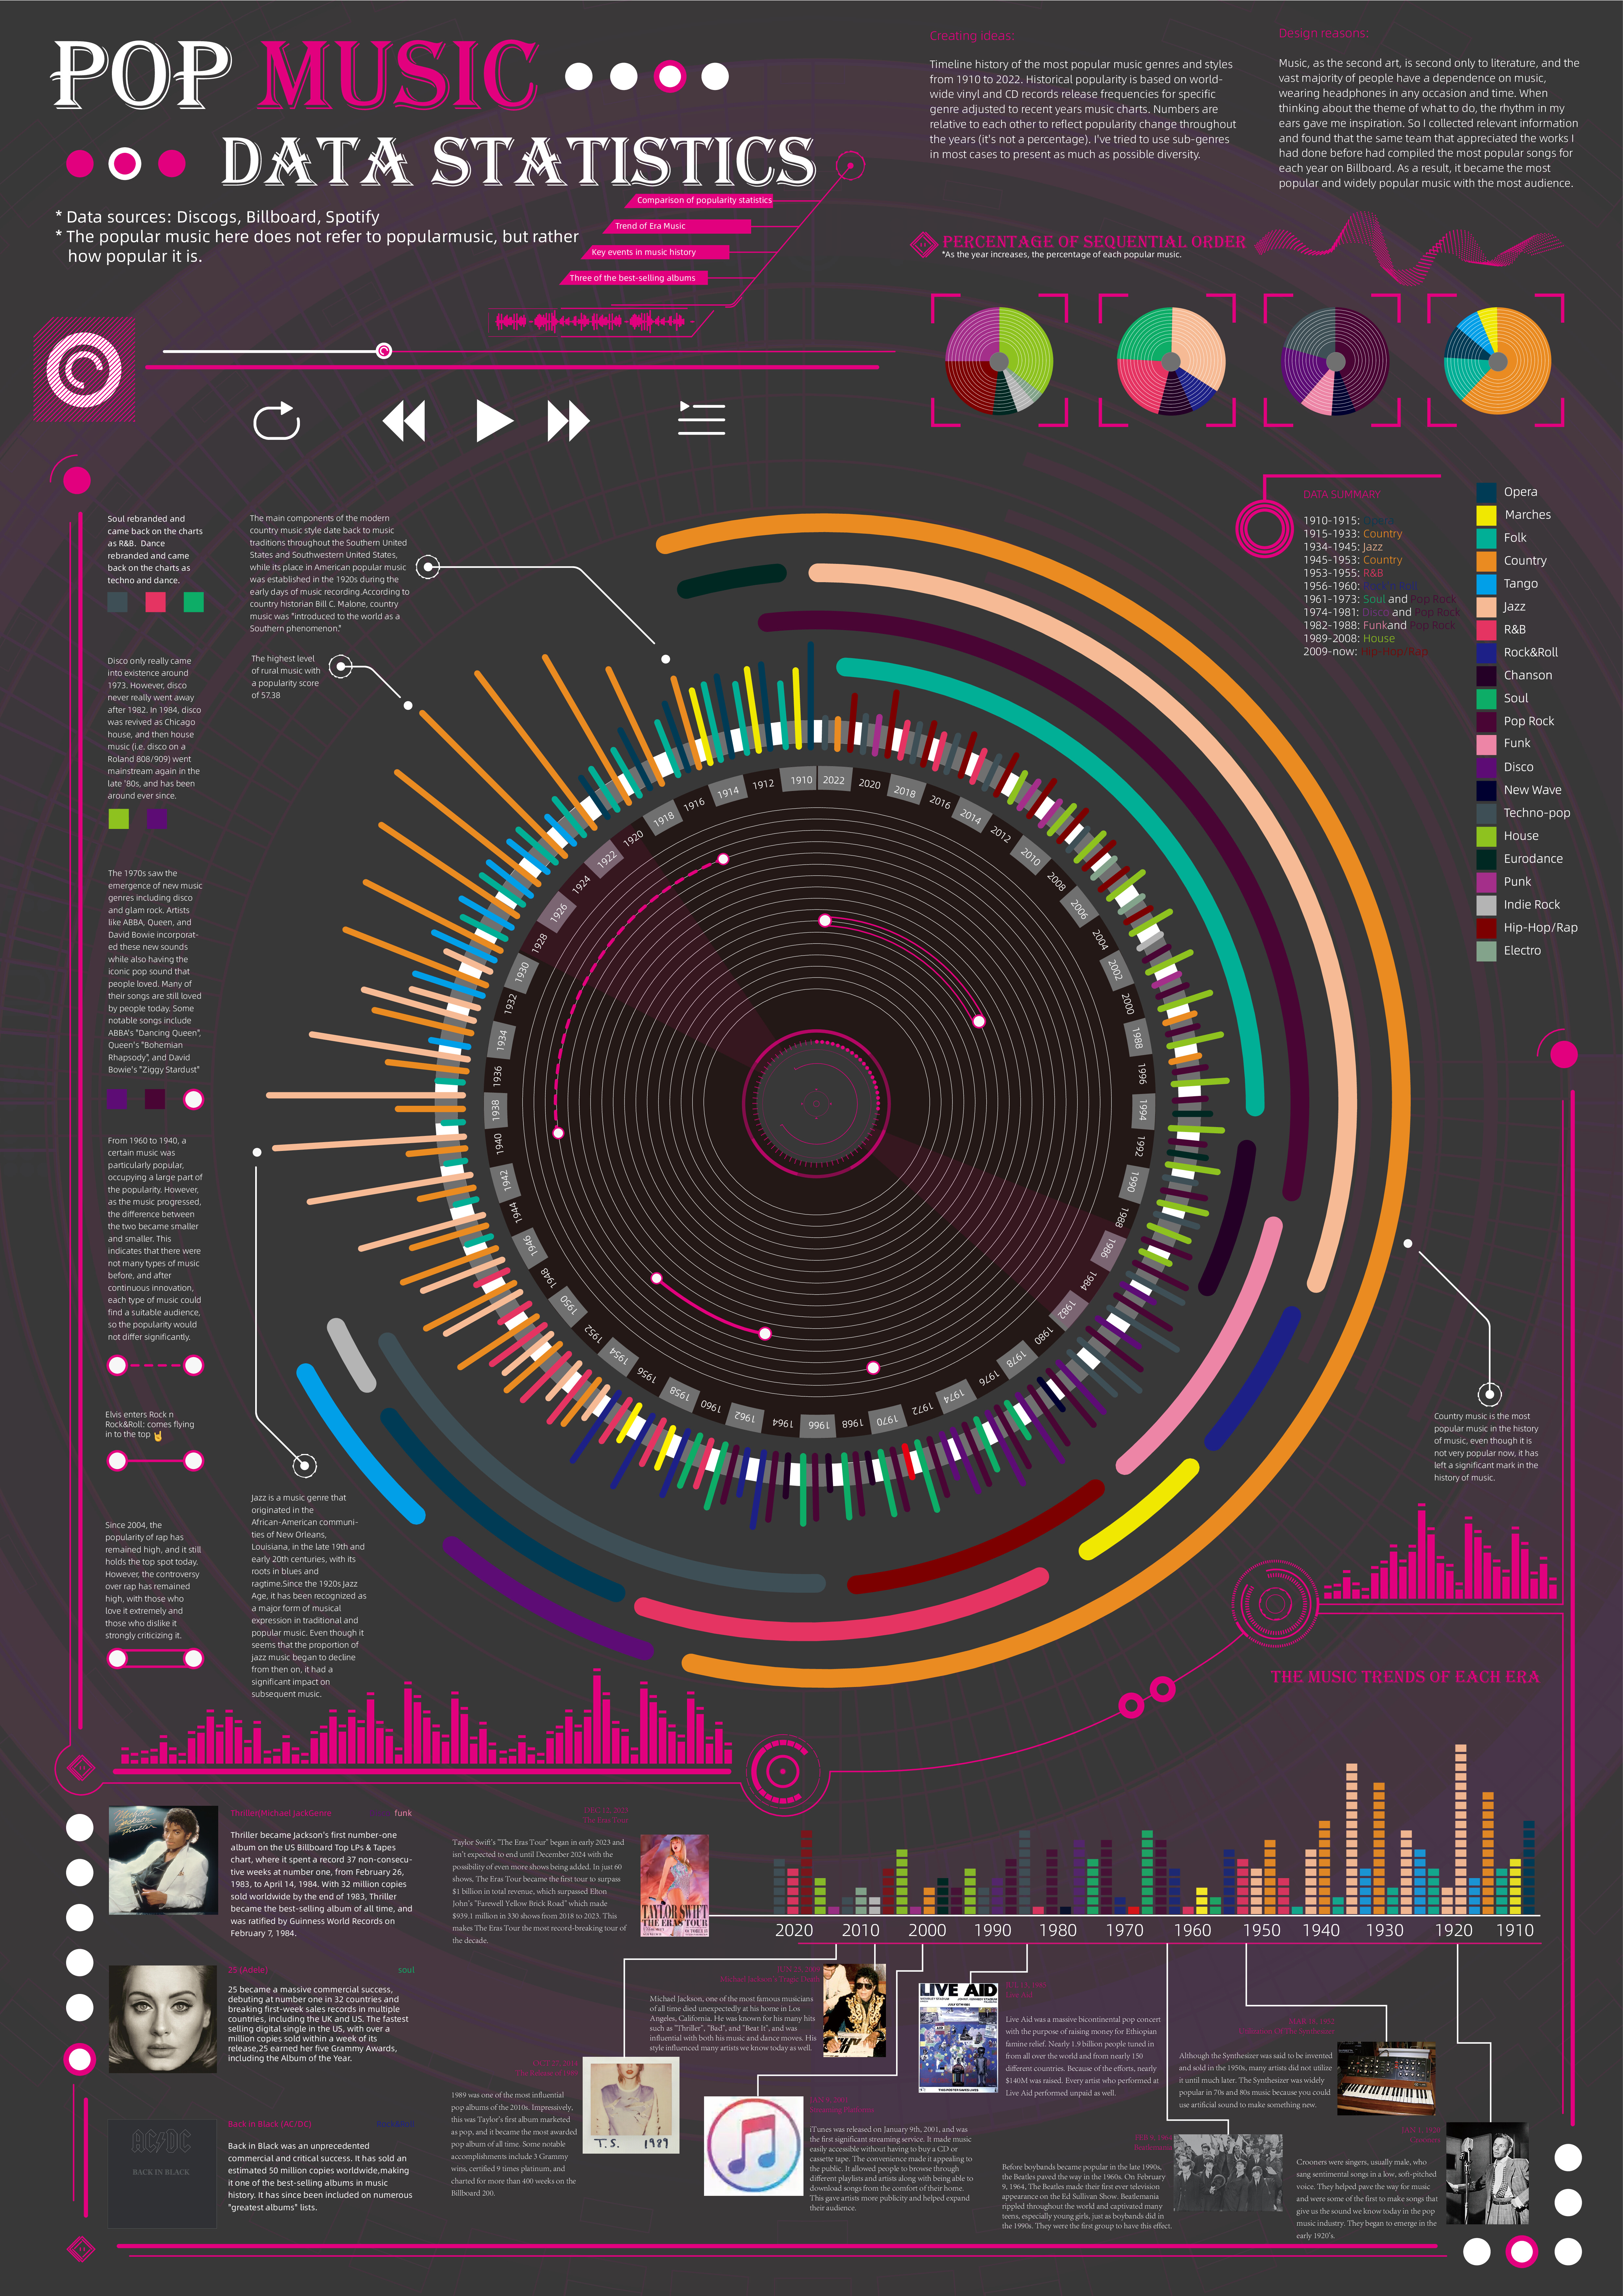
 View projectTimeline history of the most popular music genres and stylesfrom 1910 to 2022.Historical popularityis based on world-wide vinyl and CD records release frequencies for specificgenre adjusted to...
 -
 View projectThe project Life Wrapped in Passwords explores the sense of disorientation and frustration caused by our conflicting relationships with passwords, convenience, and security. In an era where digital...
 -
 View projectThe Permian-Triassic (P-T) extinction event marks the boundary between the Paleozoic and Mesozoic eras. Also known as the ‘Great Dying’, scientists estimate that up to 96% of oceanic species became...
 -
 View projectThis visualization showcases linear graphs for all pure spellcasters in D&D. It displays the maximum average spell damage per level and the corresponding dice rolled by the player. The graphs...
 -
 View projectThis visualisation shows the bathymetric contours of the Gulf of México. The light and shadow accentuates the otherwise flat blue palette to highlight the depths of the gulf. The visualisation is...